Exporting Metrics from CockroachDB Dedicated into Amazon CloudWatch
By Morgan Winslow at
Trying out a new CockroachDB feature that provides the ability to export metrics from the Dedicated service into CloudWatch

Overview
Today we will be looking at a new feature in the CockroachDB "Dedicated" offering which allows users to pipe out metrics into Amazon CloudWatch for further manipulation. This was already currently possible in the "Self-Hosted" offering of Cockroach, but is now new in Dedicated.
There has also been a DataDog integration for a while now. And CockroachDB has great built in observability tools. But it's not uncommon to want a bit more control over this observability, so today we'll look at the latest option available to us.
Leveraging this new feature will be as simple as a few API calls on the Cockroach side.
Docs page: Export Metrics From a CockroachDB dedicated Cluster
CockroachDB Cloud API: Full reference documentation
High-Level Steps
- Set up a CockroachDB Dedicated Cluster
- Create a CloudWatch Log Group
- Create an IAM Policy
- Create a cross-account IAM Role in AWS and attach the Policy
- POST request to the Cockroach Cloud API with AWS specs
- Confirm Log Stream in Log Group
Setup CockroachDB
Create a Cluster
If you don't have a cluster created already you can sign up for one here. This feature will work on single or multi-region deployments of CockroachDB.
Once created, make sure you setup your Networking first thing! You have IP Allowlist and PrivateLink available.
NOTE: The cluster must have been created after August 11, 2022 AND being provisioned on AWS
Create a Service Account
Make sure you have a Service Account set up which will allow you to issue API requests against the Cloud API.
Step by step instructions can be found here. I recommend creating an ADMIN account for this exercise, as only an ADMIN will be able to disable the metric export.
You will need the secret for each API request.
Retrieve and Save Cluster ID
Find your cluster ID in the URL of the single cluster overview page: https://cockroachlabs.cloud/cluster/{your_cluster_id}/overview. It should resemble f78b7feb-b6cf-4396-9d7f-494982d7d81e.
We need this value for each API request, so keep it handy.
Retrieve and Save Provider Account ID
The provider account ID is given by the cloud provider. We will use an API request to get this information.
Issue the following request, adding in your cluster ID and secret key from your Service Account.
curl --request GET --url https://cockroachlabs.cloud/api/v1/clusters/{your_cluster_id} --header 'Authorization: Bearer {secret_key}'This will return extended information about your cluster, but we just need to get a handle on account_id. Save this off as we'll be using it for our AWS Role.
Create a CloudWatch Log Group
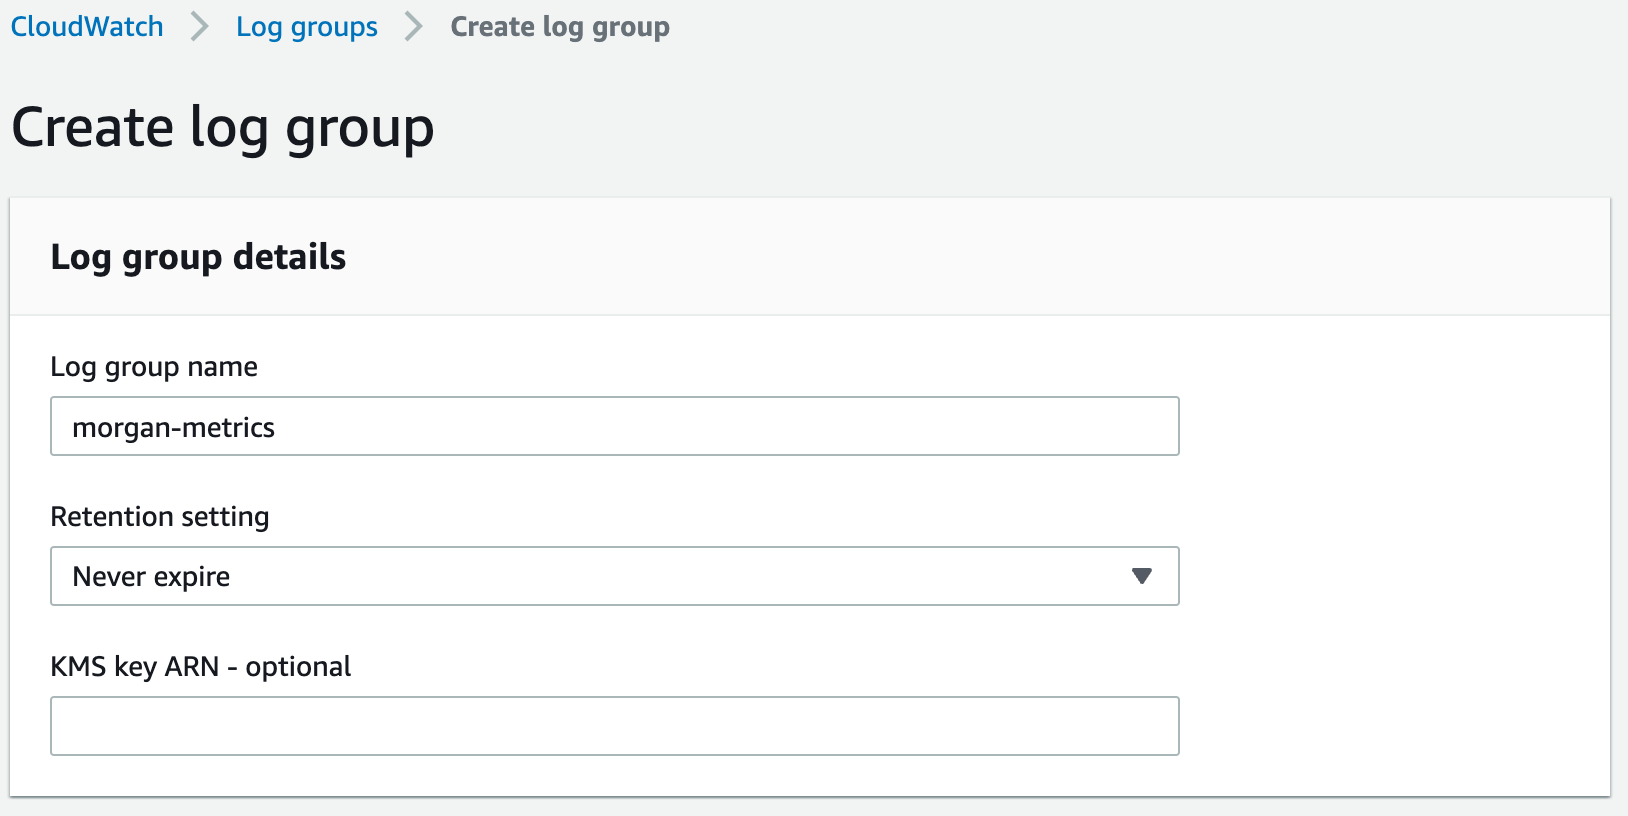
You can use a pre-existing group if you'd like, but I'm going to create a new one.
Head to CloudWatch -> Logs -> Log groups -> Create log group. You should see the following.

Go ahead and click 'Create', and that's it for this step!
Create an IAM Policy
This Policy will allow a Role to create a log stream and perform different actions on our Log Group.
Navigate to IAM -> Access Management -> Policies -> Create policy. Switch over to the JSON tab and paste the following.
{
    "Version": "2012-10-17",
    "Statement": [
        {
            "Action": [
                "logs:CreateLogGroup",
                "logs:CreateLogStream",
                "logs:DescribeLogGroups",
                "logs:DescribeLogStreams",
                "logs:PutRetentionPolicy",
                "logs:PutLogEvents"
            ],
            "Effect": "Allow",
            "Resource": [
                "arn:aws:logs:*:{your_aws_acct_id}:log-group:{log_group_name}:*"
            ]
        }
    ]
}
A couple things to note here. First, make sure your AWS account ID is the one where you are creating your Role, and not the account ID we grabbed from the API request.
Second, feel free to adjust this Resource field. You could limit to a region, or just copy the ARN (Amazon Resource Name) from your Log Group directly.
Give the Role a good name as you'll be using it in the next step.
Create an IAM Role
This Role will be leverage by CockroachDB to perform actions as a trusted entity.
Step 1: Select trusted entity
Go to the IAM service -> Access management -> Roles -> Create role. Choose "AWS account" for your Trusted Entity Type. You should see something like the following.

In the 'An AWS account' section, click 'Another AWS account'. Enter your 12 digit account ID that we saved in our first API request.
Step 2: Add permissions
For your permission policy, simply search and select the Policy you created in the previous step.
Step 3: Review
Make sure you give your Role a good name, as we'll be referencing it in our API request to Cockroach soon. I used the name CockroachCloudMetricsExportRole.
The final result should look like this. This time, the account ID should be the provider ID you retrieved from the API and the same one you entered in Step 1.
{
    "Version": "2012-10-17",
    "Statement": [
        {
            "Effect": "Allow",
            "Action": "sts:AssumeRole",
            "Principal": {
                "AWS": "arn:aws:iam::{your_aws_acct_id}:root"
            },
            "Condition": {}
        }
    ]
}
Take note of the ARN for this newly create Role.
POST Request to Enable Metrics Export
We now have everything in place in order to start the flow of metrics into CloudWatch. Leverage the POST request format below.
curl --request POST
--url https://cockroachlabs.cloud/api/v1/clusters/{cluster_id}/metricexport
--header "Authorization: Bearer {secret_key}"
--data '{"cloudwatch":{"target_region": "{aws_region}",
"role_arn": "arn:aws:iam::{role_arn}:role/CockroachCloudMetricsExportRole",
 "log_group_name": "{log_group_name}"}}'
You should be familiar with replacing your {cluster_id} and {secret_key} by now. The AWS region should be where your cluster resides. Replace the role_arn with your created Role, and the log_group_name with your created Log Group.
The response should indicate that it is in the process of 'ENABLING'. The process should be pretty quick depending on the size of your cluster, but you can check the progress with the following request.
curl --request GET --url https://cockroachlabs.cloud/api/v1/clusters/{cluster_id}/metricexport --header "Authorization: Bearer {secret_key}"When complete, the status will be ENABLED.
View Log Stream
In AWS, navigate back to your Log Group in CloudWatch and look for the crdb-metrics-stream.

You can now leverage this stream a number of different ways...but I'll save that for future blogs.
Cleanup
To disable the metrics export, issue the following DELETE request.
curl --request DELETE --url https://cockroachlabs.cloud/api/v1/clusters/{cluster_id}/metricexport?type={metrics_export_type} --header "Authorization: Bearer {secret_key}"Conclusion and Next Steps
Overall the process was extremely easy. Although it is a long blog post to spell out the steps, I was ultimately able to set up a new log stream in about 5 minutes once I understood the process.
If DataDog is something your team doesn't utilize, I think this provides an easy alternative to get additional flavor out of the metrics collected by CockroachDB.
For my personal next step, I will likely look at utilizing Grafana with these metrics.