Locust -> Benthos -> CockroachDB
By Morgan Winslow at
Using Locust (testing framework) to POST messages to Benthos (stream processing) and Insert into CockroachDB
![]()
Overview
Today I'm going to be testing out a couple of new tools that I've seen in the field. This is more of a learning exercise rather than a stress test, but these tools could definitely be optimized to do so.
For my test I will be using Locust to create N amount of users (rides) that Post latitude/longitude data to Benthos every 5 seconds. Benthos will process this data and then Insert it into a tracking table in CockroachDB.
Although this is more of a proof of concept, I will be showing some small tuning exercises I did in Locust and Benthos to achieve better results.
All code and configs for this blog can be found on GitHub here.
Considerations
Since this was just a quick test I used resources that I already had running. This includes:
- A CockroachDB Dedicated instance deployed on GCP in us-east4
- 3 nodes x 8vCPU w/ 250GiB of storage per node - An AWS EC2 instance in us-east-1 that I used to run Benthos
- m5.16xlarge (64vcpu) - A Macbook with Locust installed
This made getting going quick, but was not ideal for latency or performance testing.
High-Level Steps
- Create table in CockroachDB
- Install Benthos and setup a config file with an
http_serverinput andsql_insertoutput - Install Locust and write a
taskthat POSTS a JSON object to the Benthos http endpoint - Load test and tuning Locust and Benthos
CockroachDB
For this test I'll just be utilizing one table, called tracking, that will store latitude and longitude points for a ride. It's a bit of an oversimplification, but will do for now.
CREATE TABLE tracking (
    id UUID PRIMARY KEY NOT NULL DEFAULT gen_random_uuid(),
    ride_id UUID NOT NULL,
    latitude FLOAT8 NOT NULL,
    longitude FLOAT8 NOT NULL,
    tracking_point GEOGRAPHY(POINT,4326) NULL,
    timestamp TIMESTAMPTZ DEFAULT NOW()
);
Benthos
Overview
Benthos is a stream processing platform, similar to something like Apache NiFi. The three main components that make up Benthos are: Inputs, Pipeline (Processors), and Outputs. Inputs and Outputs cover a wide range of technologies that you can leverage for your stream.
It is deployed as a static binary, and relies on a main config yaml. On the front page of the site they claim, "It's boringly easy to use", which I found to be extremely accurate. I was able to get up and going with Benthos in minutes.
Install
Getting Started steps can be found here, but it's quick and easy so I'll list them below as well.
curl -Lsf https://sh.benthos.dev | bashTest Run
Next we'll create teh foundation of Benthos. The config file will contain all the information that it needs to run. The following command will generate a fresh file with defaults populated.
benthos create > config.yamlTest that everything was installed properly. The current config will take your stdin as input and output back to stdin.
benthos -c ./config.yamlModifications
Input
For this test I wanted to use http_server as the input. This will receive messages POSTed over HTTP(S). Benthos already has an http section of the config by default, and I'm going to leave that unchanged. The http_server section below is separate and as an input.
input:
  http_server:
    address: ""
    path: /tracking
    ws_path: /post/ws
    allowed_verbs:
      - POST
    timeout: 5s
    rate_limit: ""
These are all defaults except for the path which I decided to make /tracking since that's the name of my table. You can find more available fields in the link above.
Output
For Output, I will be using the sql_insert option. This will allow me to insert a row into a SQL database for each message.
output:
  label: ""
  sql_insert:
    driver: "postgres"
    dsn: postgresql://username:password@hostname:26257/defaultdb?sslmode=verify-full&sslrootcert=your_cert.crt
    table: tracking
    columns: [ride_id, latitude, longitude]
    args_mapping: root = [ this.tracking.ride_id, this.tracking.latitude, this.tracking.longitude ]
This was also pretty straightforward. Benthos has a number of drivers available, but I'll be using the postgres driver for CockroachDB compatibility.
Next define the table name and columns that we'll insert into.
args_mapping uses a Bloblang mapping which should evaluate to an array of values matching in size to the number of columns specified. Bloblang is also a cornerstone of Benthos, but I won't be going too deep into it here. All you need to know here is that we'll be grabbing the ride_id, latitude, and longitude from a JSON tracking object sent over from Locust. This is what will be inserted into CockroachDB.
We'll update this output up a bit when we get to the tuning portion, but this works for now.
Processors
For this test, I chose to leave the pipeline section of the config empty. It's something I'd like to get into more another time, but wasn't the focus of this test. You can read more about Benthos Processors here.
Locust
Overview
This was also my first time using Locust, an open source load testing tool where you can define user behavior via Python. Similar to Benthos, I found it really fast to get up and going quickly.
Install
pip3 install locustSetup
Here we will be writing a locustfile, which is just a normal Python module. I'll be keeping mine pretty simple, but you can look [here] for more in depth details on writing your first locustfile.
The core of the locustfile is a @task. For each user that is spawned, Locust will create a greenlet (micro-thread) that calls these methods. You are able to create many tasks, assign weighted priorities, etc. For our case, we'll just have one task that is POSTing to our Benthos server every 5 seconds.
Here is the code below, with a bit of extra fluff to simulate more realistic data.
from locust import HttpUser, task

class TrackRides(HttpUser):
    @task
    def post_tracking_point(self):
        latitude, longitude = generate_random_lat_long()
        ride_id = uuid.uuid4()
        for point in range(100):
            self.client.post("/tracking", None, {"tracking":{"ride_id": str(ride_id), "latitude": latitude, "longitude":longitude}})
            latitude, longitude = get_next_lat_long(self, latitude, longitude) # generate new lat/long ~1 mile away
            time.sleep(5)
You'll notice I had to define a class that inherits from HttpUser. A locustfile must contain at least one class inheriting from User.
That's it! You can also leverage config files but for this test, just naming the file locustfile.py is enough to get us going.
Test Run
Just run the following...
$ locust...and navigate to http://localhost:8089/. Update the Host input with your Benthos endpoint, port, and path that we set.
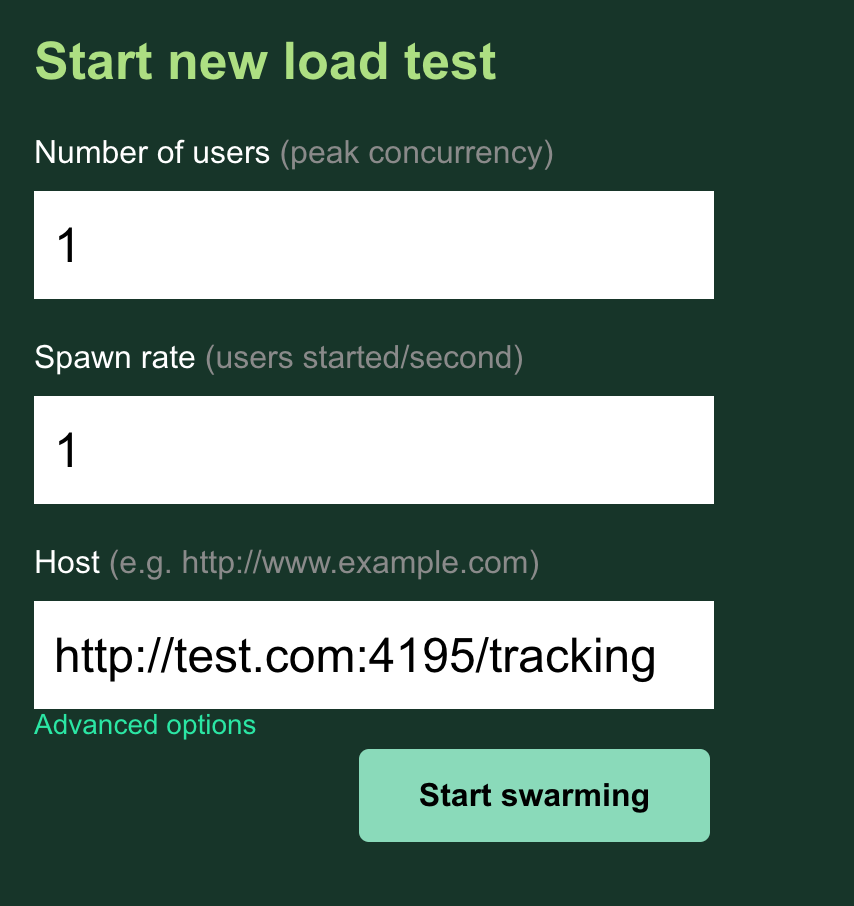
Once you start the test, you should be able to see the requests start to fire off in the Locust Web UI. Locust will indicate if requests are failing, in which case you should investigate Locust and Benthos outputs. If no requests are failing, check your CockroachDB table for data!
Scaling and Tuning
I decided, semi arbitrarily, to test with 20k users at a spawn rate of 100. The primary goal of this project wasn't necessarily scale testing, but I wanted to go into it at least a little bit. Luckily, both Benthos and Locust made it pretty easy to do quick adjustments.
Locust
Workers
I originally ran the 20k user test with just the one locust process and I started seeing CPU warnings/errors pretty on. Quick digging led me to learning about the --master and --worker flags for a more.
locust --masterIn a separate terminal(s) you can run any number of the following
locust --workerAs long as the worker is on the same machine as the host, just these two commands is enough. If not, you will need to specify a --master-host flag for the worker(s). You can read more about distributed load generation here.
I ended up running 9 workers for my test.
FastHttpUser
FastHttpUser is one way that Locusts suggests to increase performance. I did not personally add this for my tests, but is one of the first things I'd try in future ones. You can read more here.
Benthos
Benthos has a performance tuning page that highlights some common solutions to improving performance. Below are a couple that I tried that I think are most beneficial.
Batching
Batching was by far the biggest adjustment made during my tuning process. I knew this was something that would be favorable for CockroachDB coming into this exercise, but I wanted to give it a go without first.
To add batching to your sql_insert output in the config file, add the following:
batching:
    count: 100
    period: 1s
You should test with a few different numbers for your own workload. Possibly even batching up to 1,000.
Batching Results
I did not notice any major changes in throughput when batching was added; Cockroach was still able to keep up with the users either way. But there are a few improvements to point out:
- CockroachDB CPU%
No Batching: ~50%
Batching: ~5% - SQL Connections
No Batching: ~40 connections per node, peaked at 150
Batching: ~3 total - Latency
No Batching: ~50ms
Batching: ~5-6ms
You can read more about batching for sql_insert here.
max_in_flight
The max_in_flight field for sql_insert determines, "the maximum number of inserts to run in parallel". The default is 64. I personally didn't notice much difference when messing with this number in my tests but I'm guessing it's bc my test was not big enough. This field would be one to keep an eye on for larger tests, especially for a system like CockroachDB that can handle this throughput well.
Results
As I mentioned, I was shooting for 20k Locust users with a Spawn Rate of 100 and 9 workers distributing the load. Each one of these users would be POSTing to Benthos every 5 seconds, and in turn Benthos would batch to CockroachDB in batches of 100. This test included all tuning pieces mentioned above.
I Failed...Kinda
I ended up killing the test after it hit 18,500 users. Every time I ran the test there would be a massive latency spike whenever I hit 16,500 users. It turns out I was getting an HTTP Error 429 - too many requests. I think this is more from the AWS EC2 side of things rather than Benthos...It may have even been flagged as a DDOS.
I decided 16,500 I had seen enough and doing any workarounds/solutions wasn't quite worth the effort. You can see below that up until 16,500 users the growth was linear. (Despite the spike at the end, I'd largely ignore the response time metrics because of my wonky setup across clouds/regions/devices.)
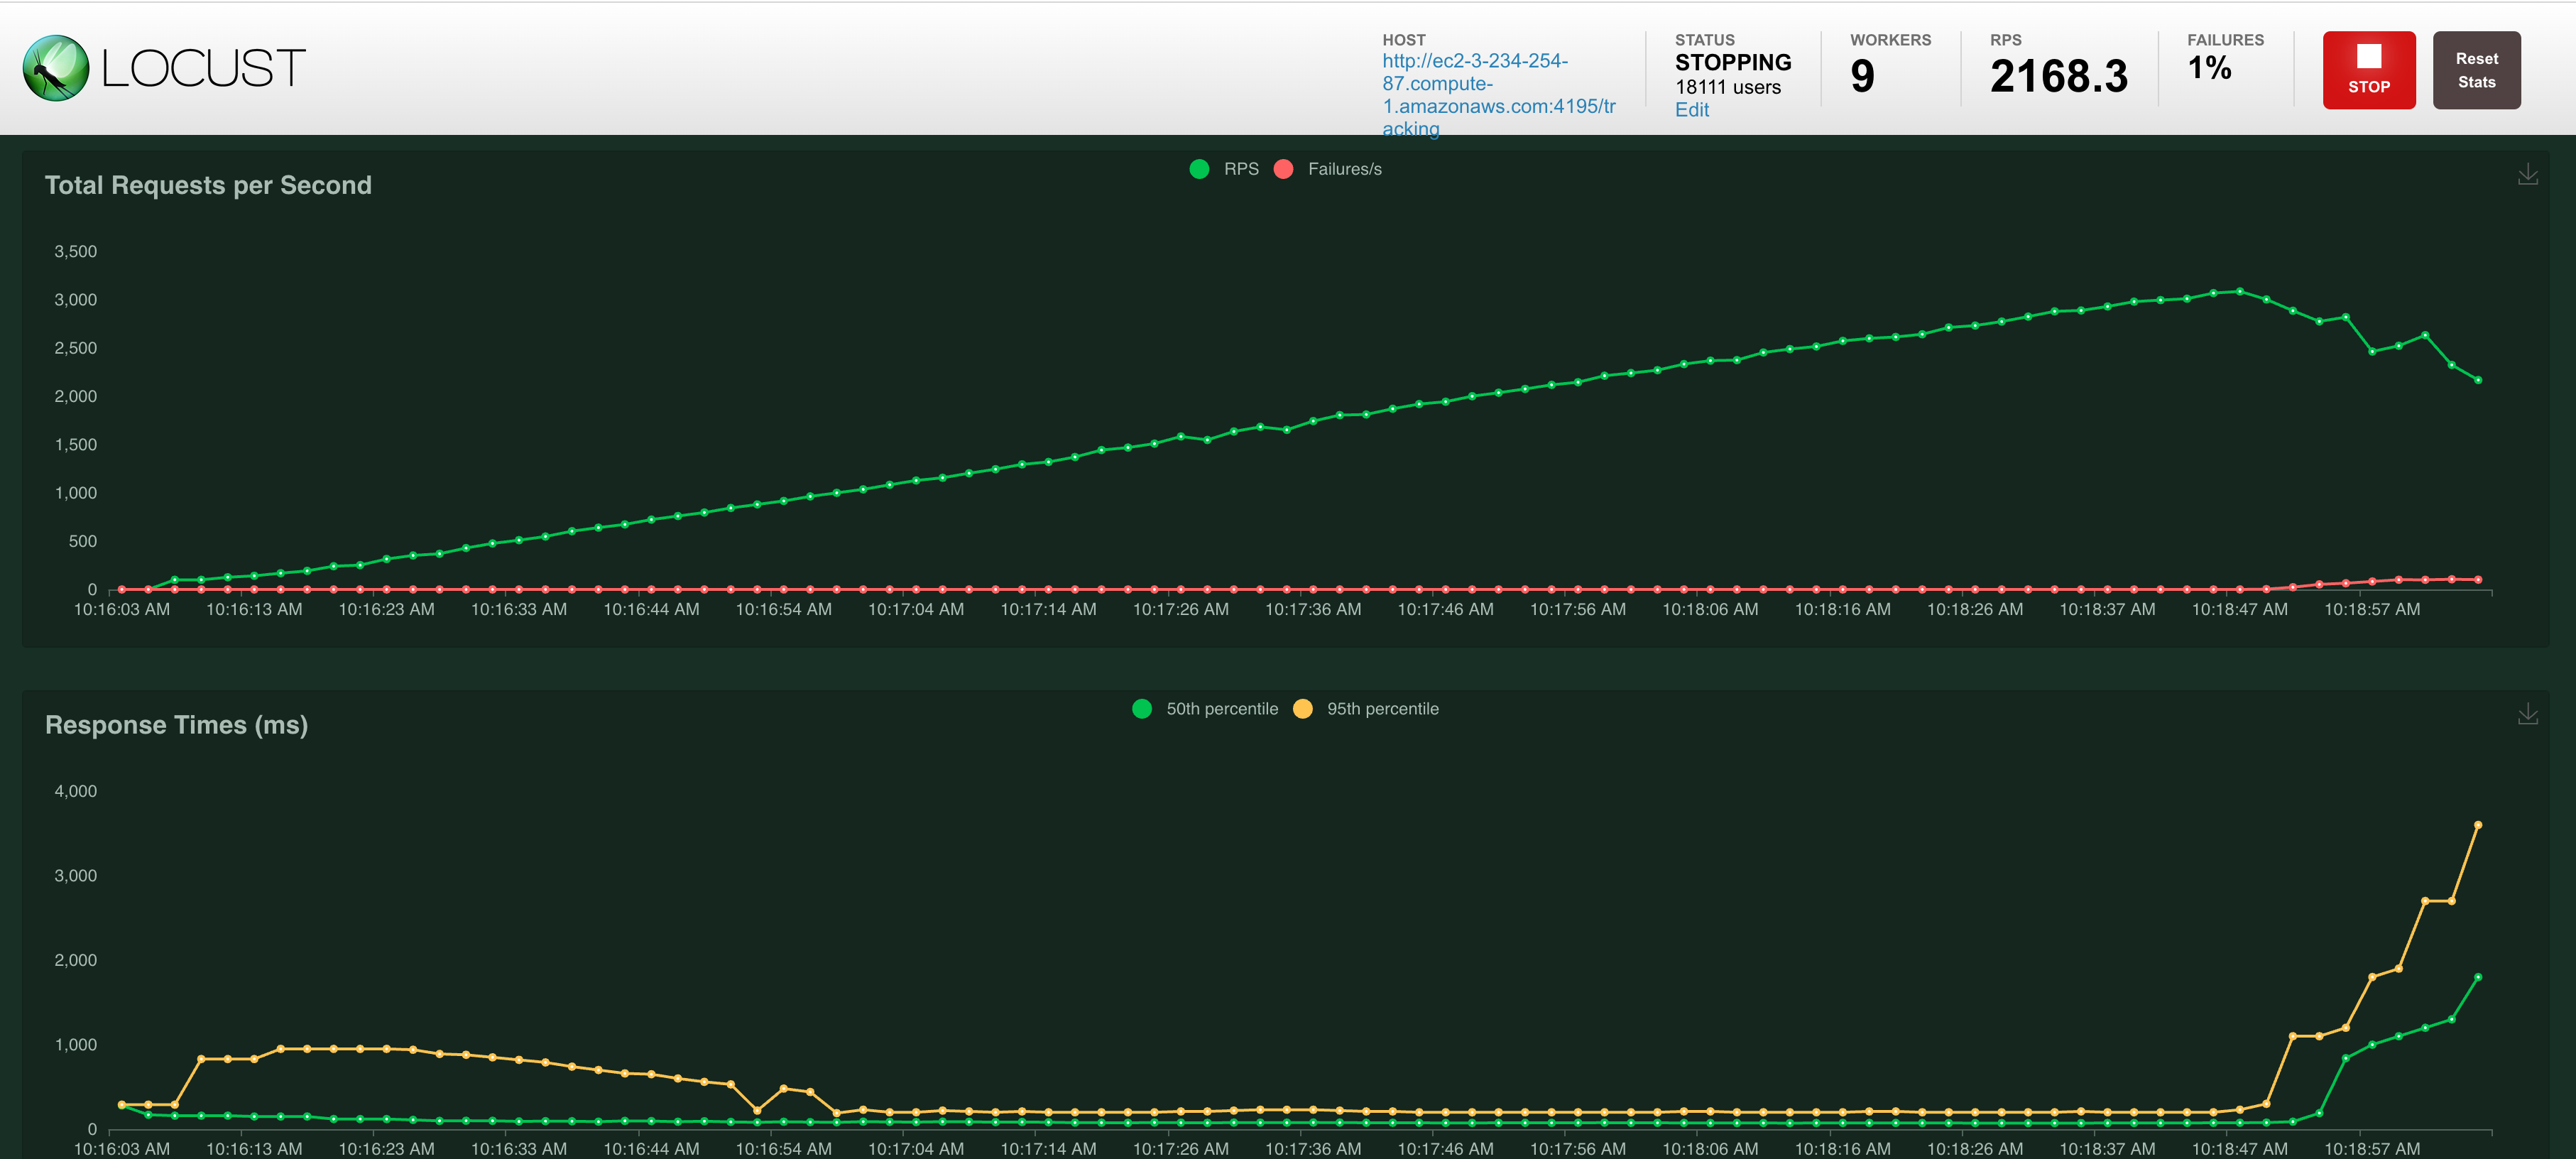
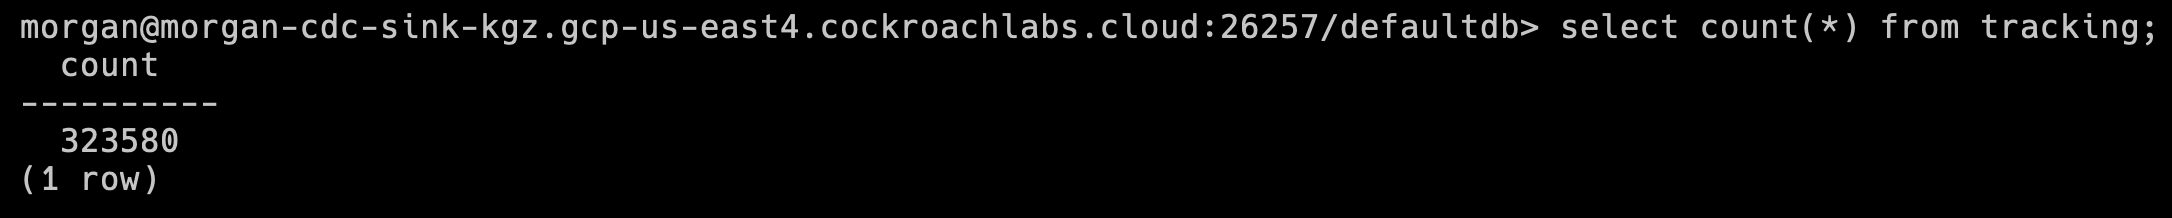
Before the "crash" we were at 16,500 users and 3,085 requests/s with no failures. During this brief ~3 minutes, 323,580 rows were inserted into CockroachDB.
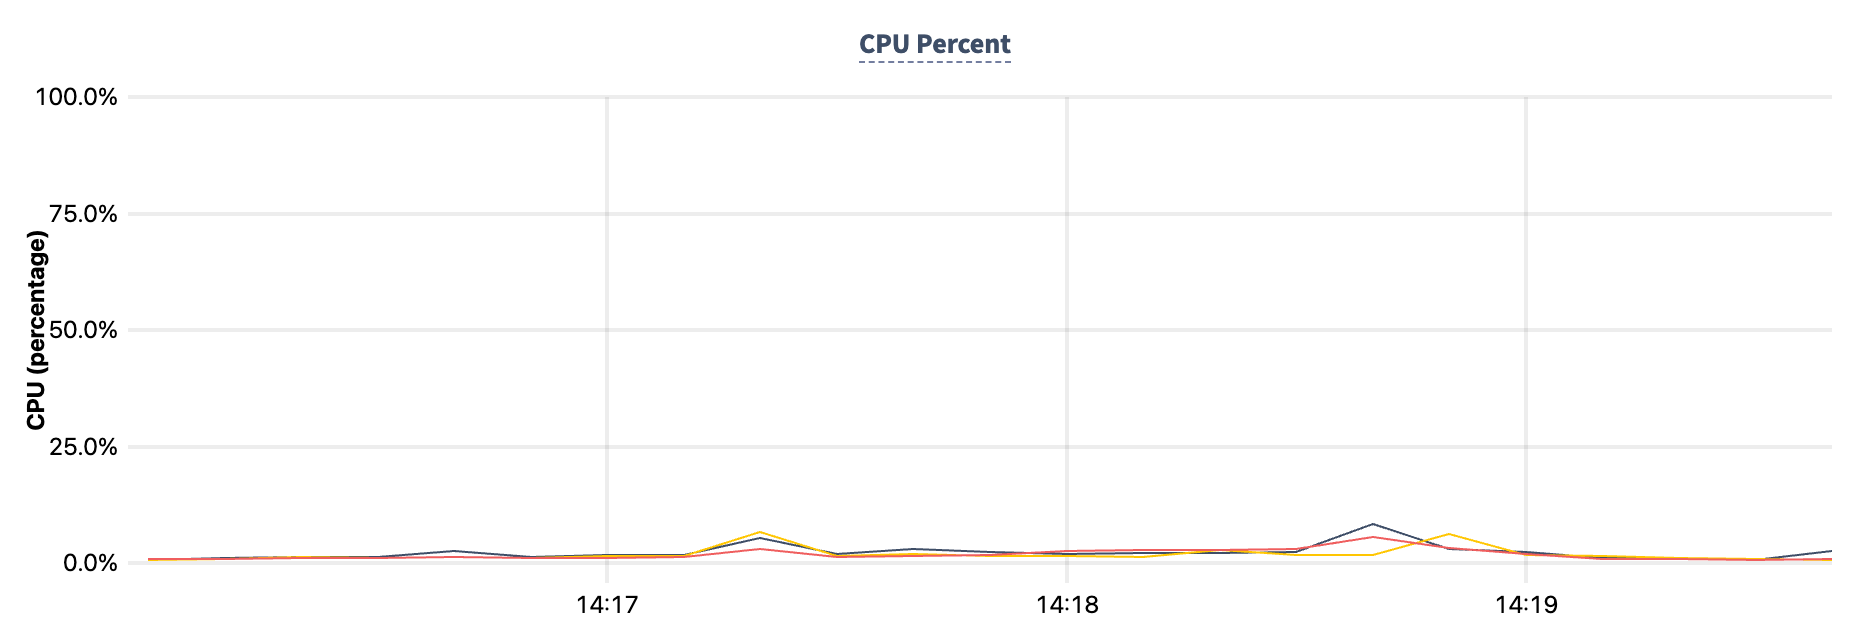
More importantly, CockroachDB was very clearly not a bottleneck during this test! Below is the CPU% during the time of the test, which is barely noticeable.
Conclusion and Next Steps
This was one of the more fun projects I've done in a while and I hope to use Locust and Benthos more in the future. Now that I know how to do the basic setup, I could get this whole stack up and going in minutes.
There's a few things I'd expand upon given the time:
- Push CockroachDB to its limits with this stack. I'd probably start by splitting/spoofing the Locust requests from different IPs to see how that'd work.
- Add in some Benthos Processing
- Introducing reads, foreign keys, and larger table structure