Viewing CockroachDB Dedicated Metrics in Grafana via Amazon CloudWatch
By Morgan Winslow at
Export CockroachDB metrics to CloudWatch, and use as a Data Source in Grafana

Overview
In this project I'll be building on my previous blog, where I tested out the new capability of exporting metrics from CockroachDB dedicated into CloudWatch.
Now that we have the metrics in CloudWatch there's a number of different options available to us. The first integration I wanted to check out was with Grafana.
Grafana is an easy to use observability platform with a generous free tier. I have some experience with it, but won't claim to be an expert. The end goal will be to re-create some of the built-in charts that are already available in the CockroachDB Console.
High-Level Steps
- Export CockroachDB metrics to Amazon CloudWatch. I will not be going over these details in this blog, but you can find all the steps in my previous blog: Exporting Metrics from CockroachDB Dedicated into Amazon CloudWatch
- Create an IAM Role and Policy to access metrics
- Configure CloudWatch as a Data Source in Grafana
- Create a Grafana Dashboard with a couple example Panels
More information on many of these steps can be found in Grafan's documentation: AWS CloudWatch data source
Create IAM Role and Policy
Grafana allows for a number of different authentication methods which are outlined here: Configure AWS authentication.
I will be utilizing the AWS Access and Secret Key method of connecting.
Create IAM Role
Navigate to IAM -> Access management -> Roles -> Create role. Choose 'AWS account' for the Trusted Entity, and "This account" for the account type. The account type may defer if you choose a different authentication type other than access/secret key.
Go ahead and skip over the Permissions for now, and create the Role with the name of your choice. The final result for the Trusted Entity should look like this.
{
    "Version": "2012-10-17",
    "Statement": [
        {
            "Effect": "Allow",
            "Principal": {
                "AWS": "arn:aws:iam::{your_aws_acct_id}:root"
            },
            "Action": "sts:AssumeRole",
            "Condition": {}
        }
    ]
}
Create IAM Policy
Navigate to IAM -> Access management -> Policies -> Create Policy. Grafana provides a number of IAM Policy examples in it's documentation. The examples include: metrics-only, logs-only, metrics and logs, and cross-account observability.
I'll be copying 'metrics and logs', as well as 'cross-account observability, since I'm not sure what all I'll want to end up digging into. You can probably whittle this down to fit your needs, especially for the 'Resource' section which is currently allowed for all.
The JSON for my Policy ended up looking like the following:
{
    "Version": "2012-10-17",
    "Statement": [
        {
            "Sid": "AllowReadingMetricsFromCloudWatch",
            "Effect": "Allow",
            "Action": [
                "cloudwatch:DescribeAlarmsForMetric",
                "cloudwatch:DescribeAlarmHistory",
                "cloudwatch:DescribeAlarms",
                "cloudwatch:ListMetrics",
                "cloudwatch:GetMetricData",
                "cloudwatch:GetInsightRuleReport"
            ],
            "Resource": "*"
        },
        {
            "Sid": "AllowReadingLogsFromCloudWatch",
            "Effect": "Allow",
            "Action": [
                "logs:DescribeLogGroups",
                "logs:GetLogGroupFields",
                "logs:StartQuery",
                "logs:StopQuery",
                "logs:GetQueryResults",
                "logs:GetLogEvents"
            ],
            "Resource": "*"
        },
        {
            "Sid": "AllowReadingTagsInstancesRegionsFromEC2",
            "Effect": "Allow",
            "Action": [
                "ec2:DescribeTags",
                "ec2:DescribeInstances",
                "ec2:DescribeRegions"
            ],
            "Resource": "*"
        },
        {
            "Sid": "AllowReadingResourcesForTags",
            "Effect": "Allow",
            "Action": "tag:GetResources",
            "Resource": "*"
        },
        {
            "Action": [
                "oam:ListSinks",
                "oam:ListAttachedLinks"
            ],
            "Effect": "Allow",
            "Resource": "*"
        }
    ]
}
Assign Policy to your Role
Head back to the Role we created, and assign the Policy. Take note of your ARN for the Policy, as we'll be using it in our Grafana Data Source setup.
This concludes all the necessary steps on the AWS side.
Create a Grafana Data Source
In Grafana Cloud, head to Configuration -> Data sources. Click add data source and search for 'cloudwatch'.
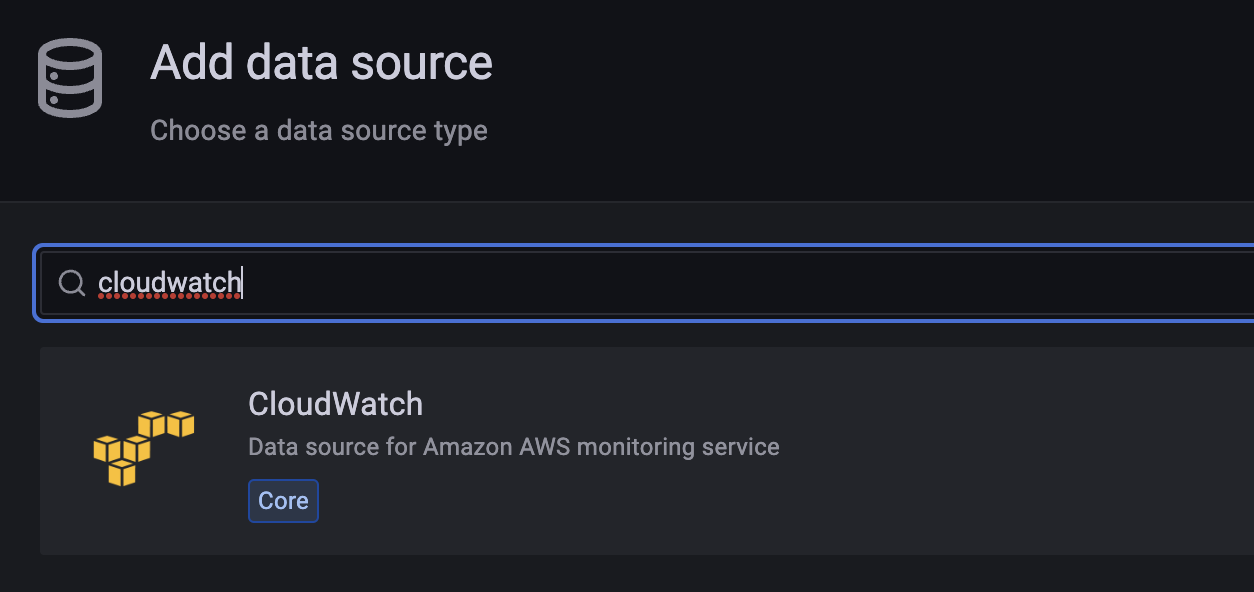
Once selected, you should be presented with the configuration settings to connect. This part should be pretty straightforward, with just a couple pieces to point out.
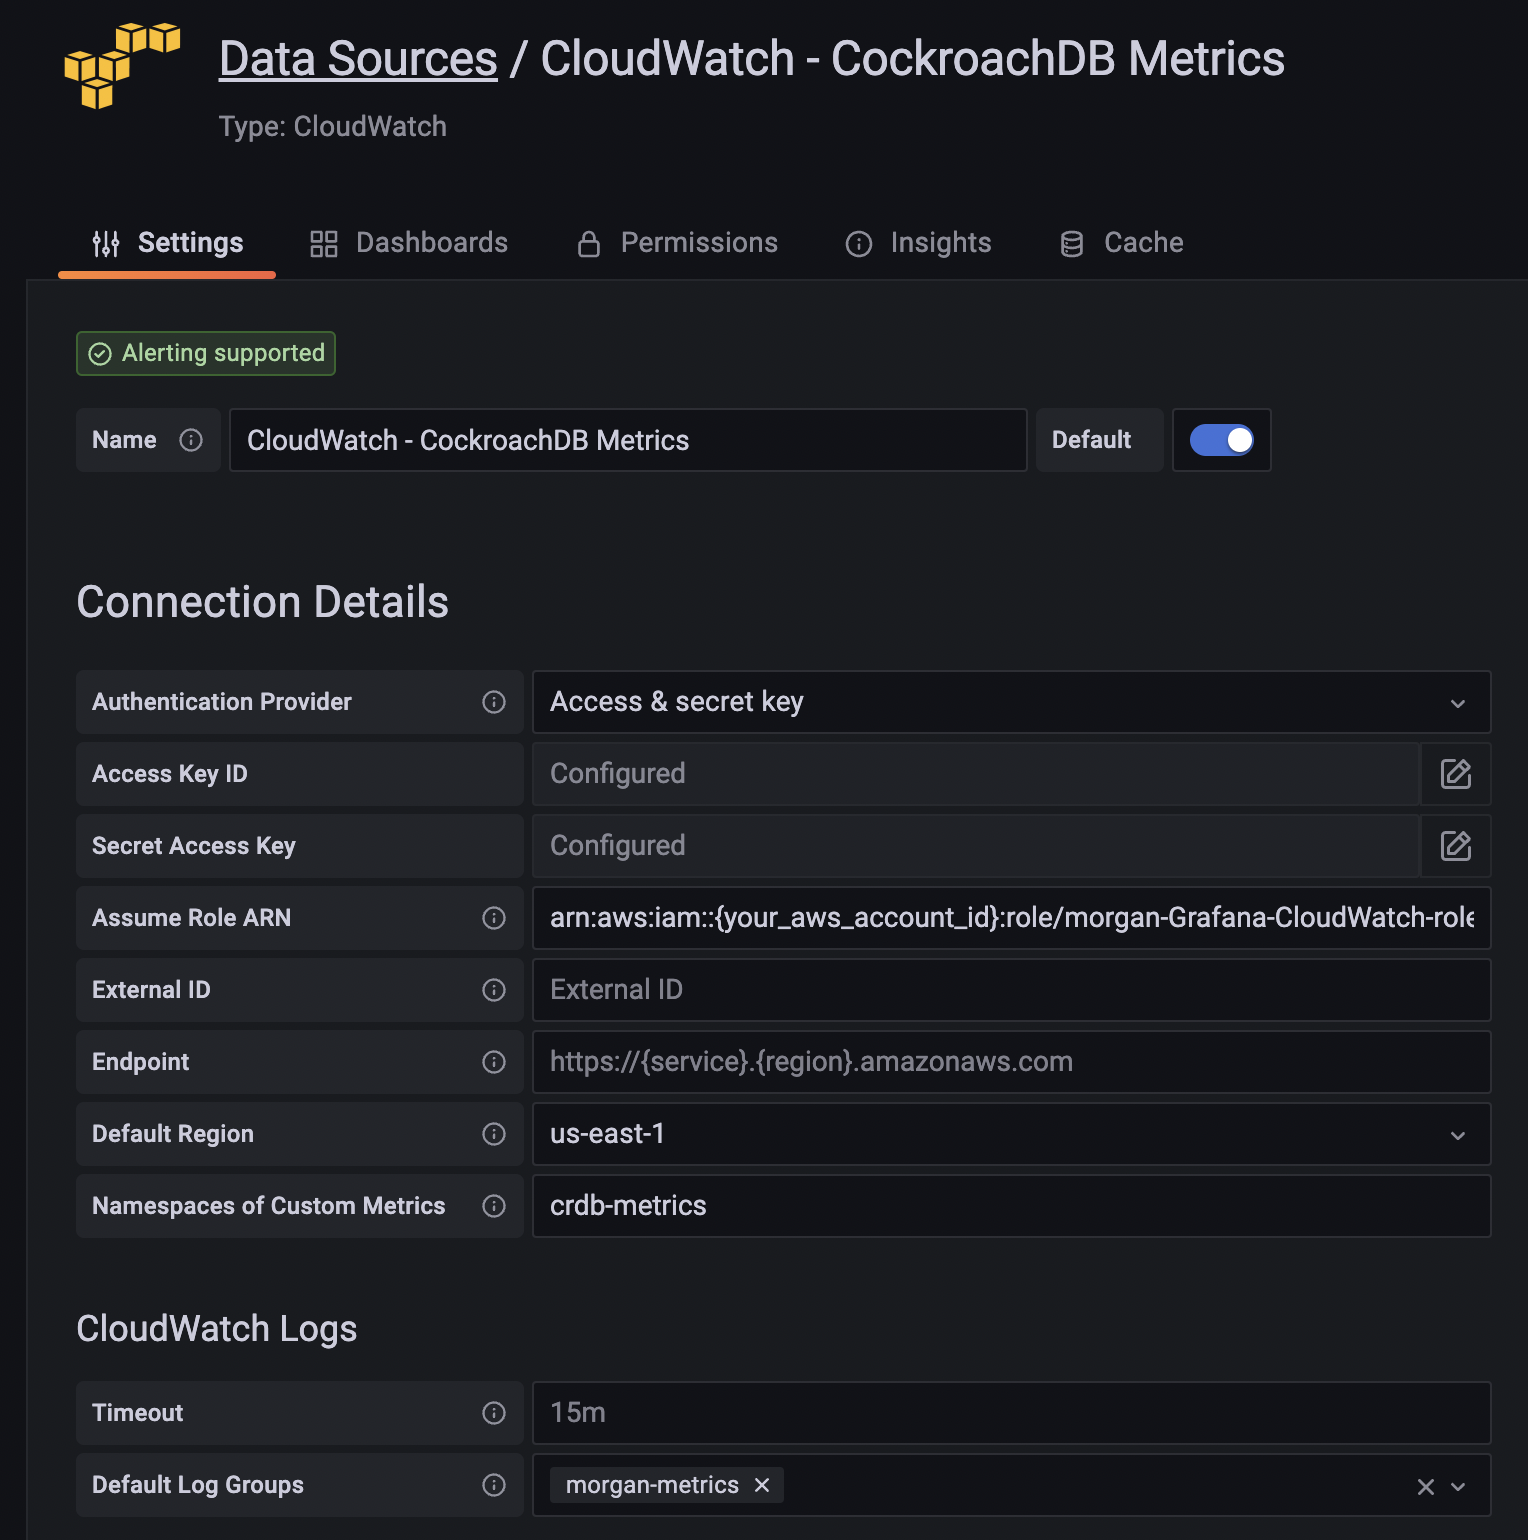
The main thing to point out here, is that you need to explicitly call out the namespace(s) of any custom metrics. In this case, the CockroachDB custom namespace is crdb-metrics.
Grafana should now be able to read from CloudWatch!
Create Dashboard and Panels
Let's walk through creating two different panels in a Grafana Dashboard.
Capacity
The Capacity panel will display a time series graph of Used Capacity, Available Capacity, and Max Capacity. First we'll build the queries, and then I'll show the chart settings I adjusted.
Queries
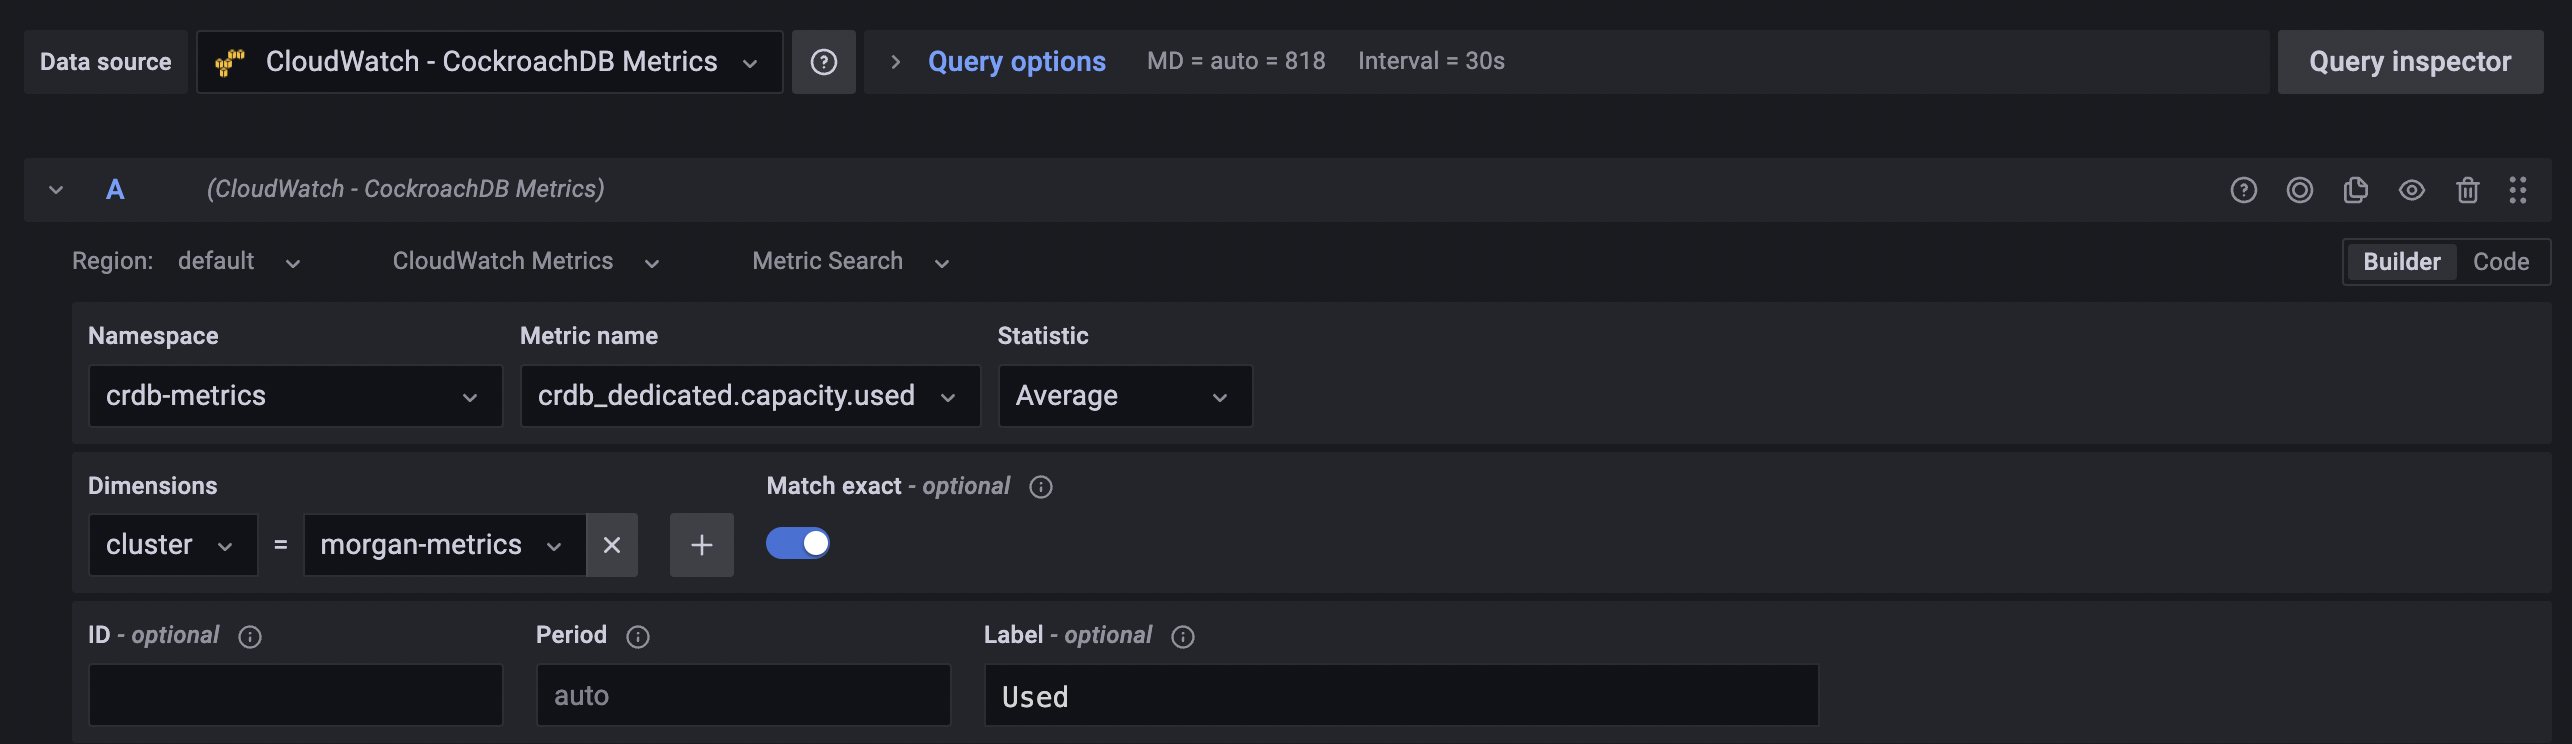
After selecting 'Add a Panel', choose your CloudWatch config as a Data Source. This may be pre-selected if you set it as your default during initial setup. Below are the rest of the settings for 'Used Capacity'.
- Namespace:
crdb-metrics - Metric Name:
crdb_dedicated.capacity.used - Statistic:
Average(default) - Dimensions:
cluster = {your_cockroachdb_cluster_name} - Label:
Used
The final result should look like the following.
You can use the copy feature to copy this Query two times, then just changing the Metric Name and Label.
- Available Capacity:
crdb_dedicated.capacity.available - Max Capacity:
crdb_dedicated.capacity
Chart Settings
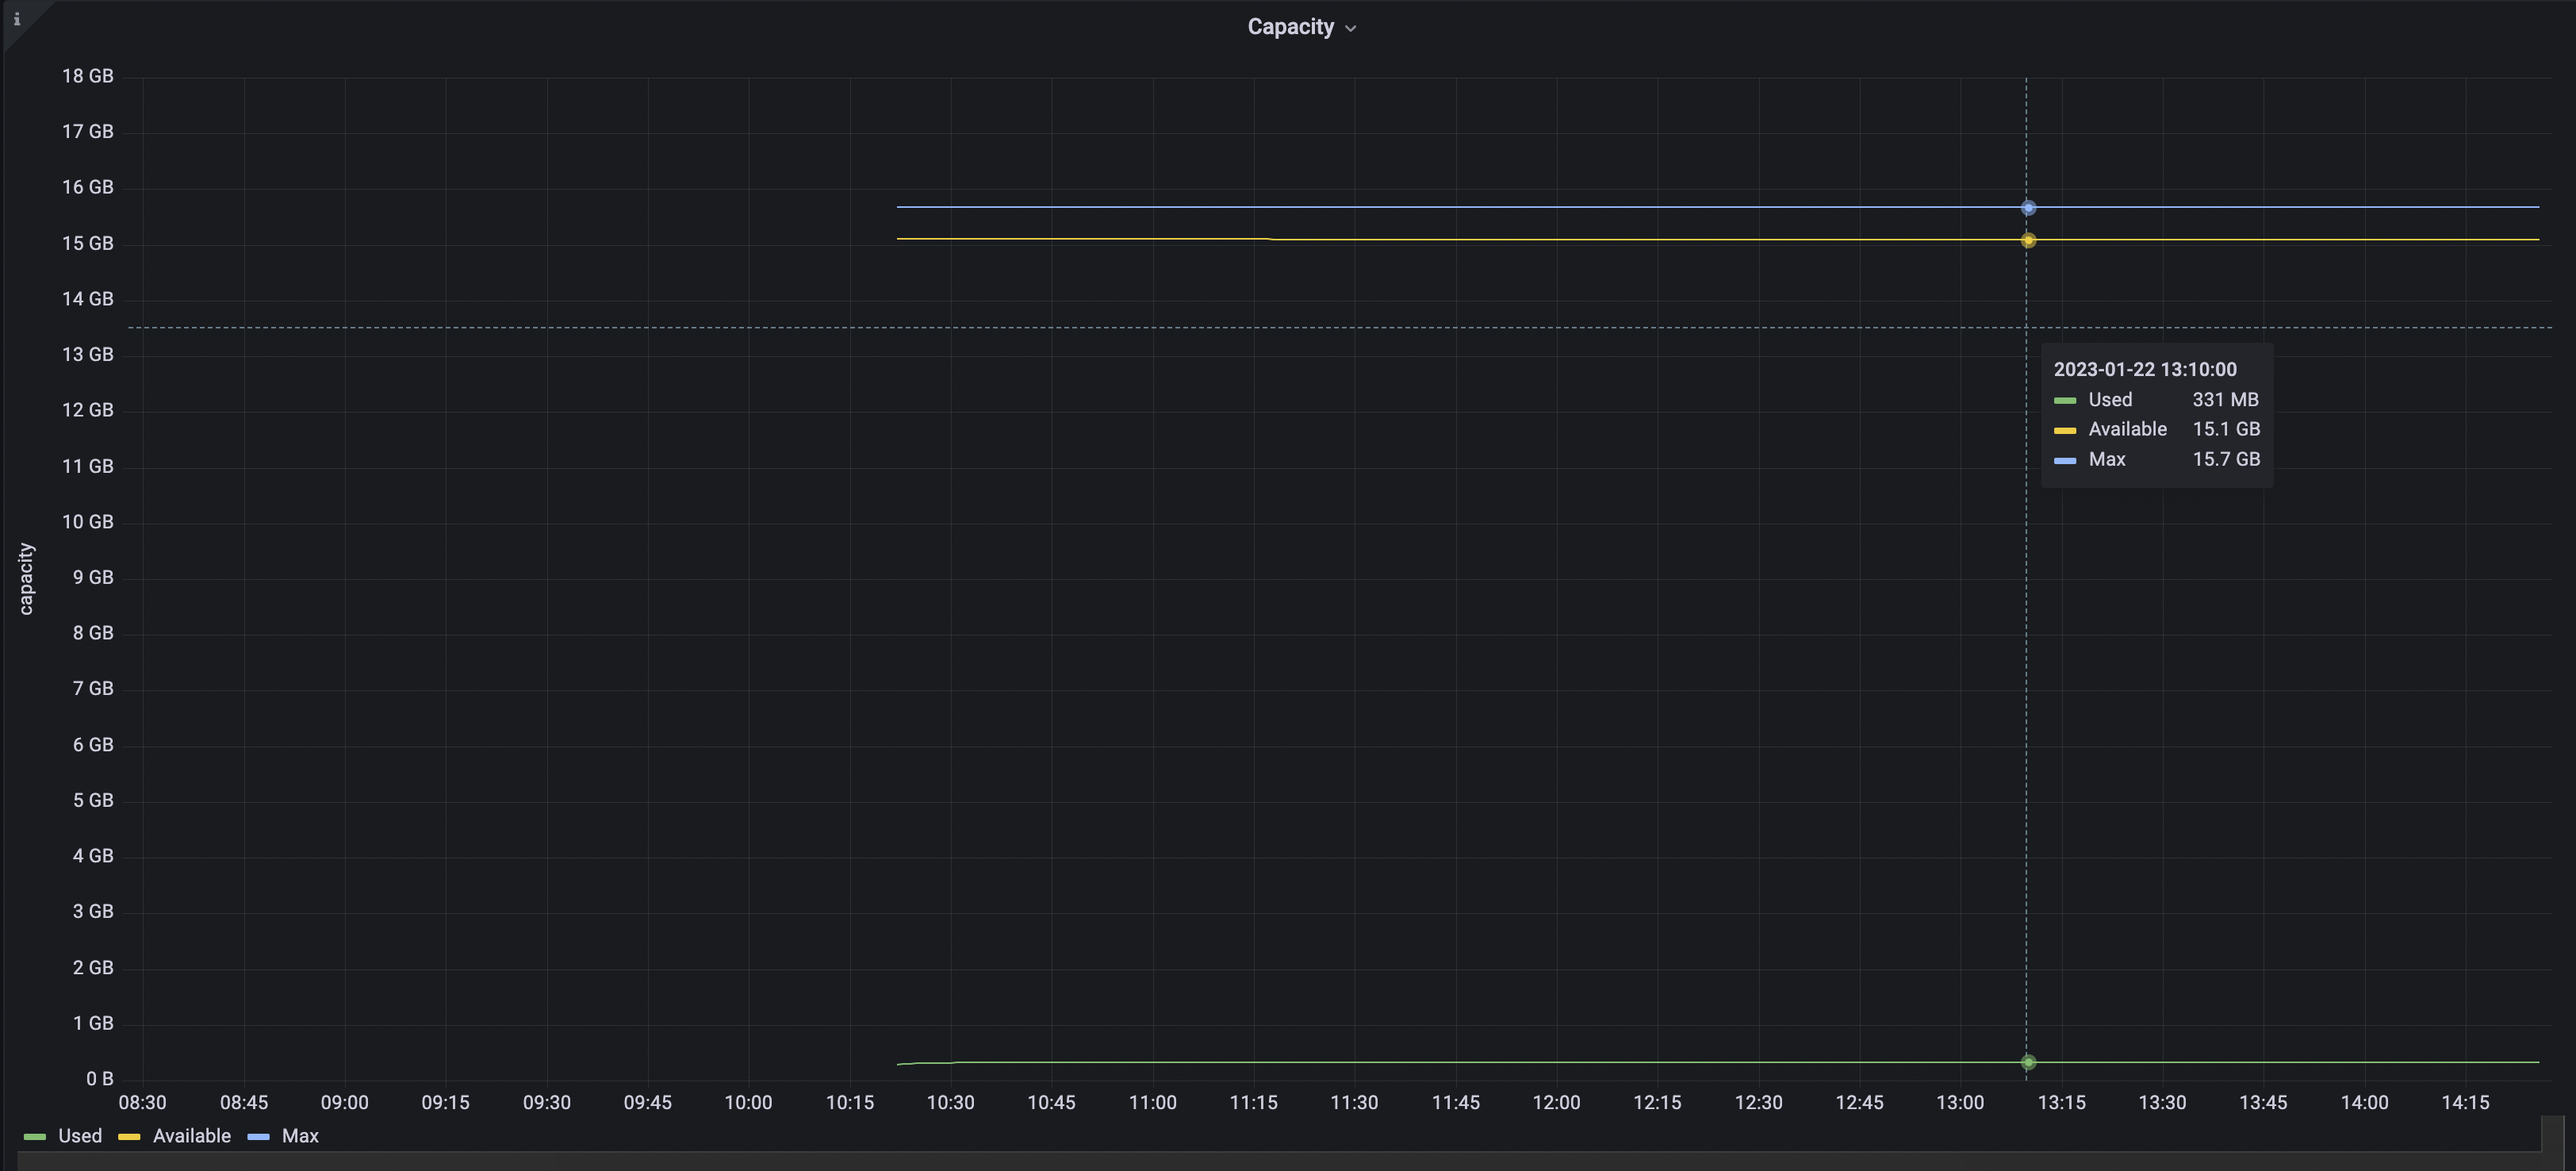
There's plenty to customize here, but these are the settings I have. Most useful to me were the Tooltip Mode and Unit.
- Title:
Capacity - Description:
Usage of disk space across all nodes - Tooltip mode:
All(This allows us to see values for each series when hovering on the chart) - Axis -> label:
capacity - Standard Options -> Unit:
Bytes
The final chart should look something like this. I currently don't have a workload running against the database, so the capacity lines are flat. You can also see the point at which I created my cluster.
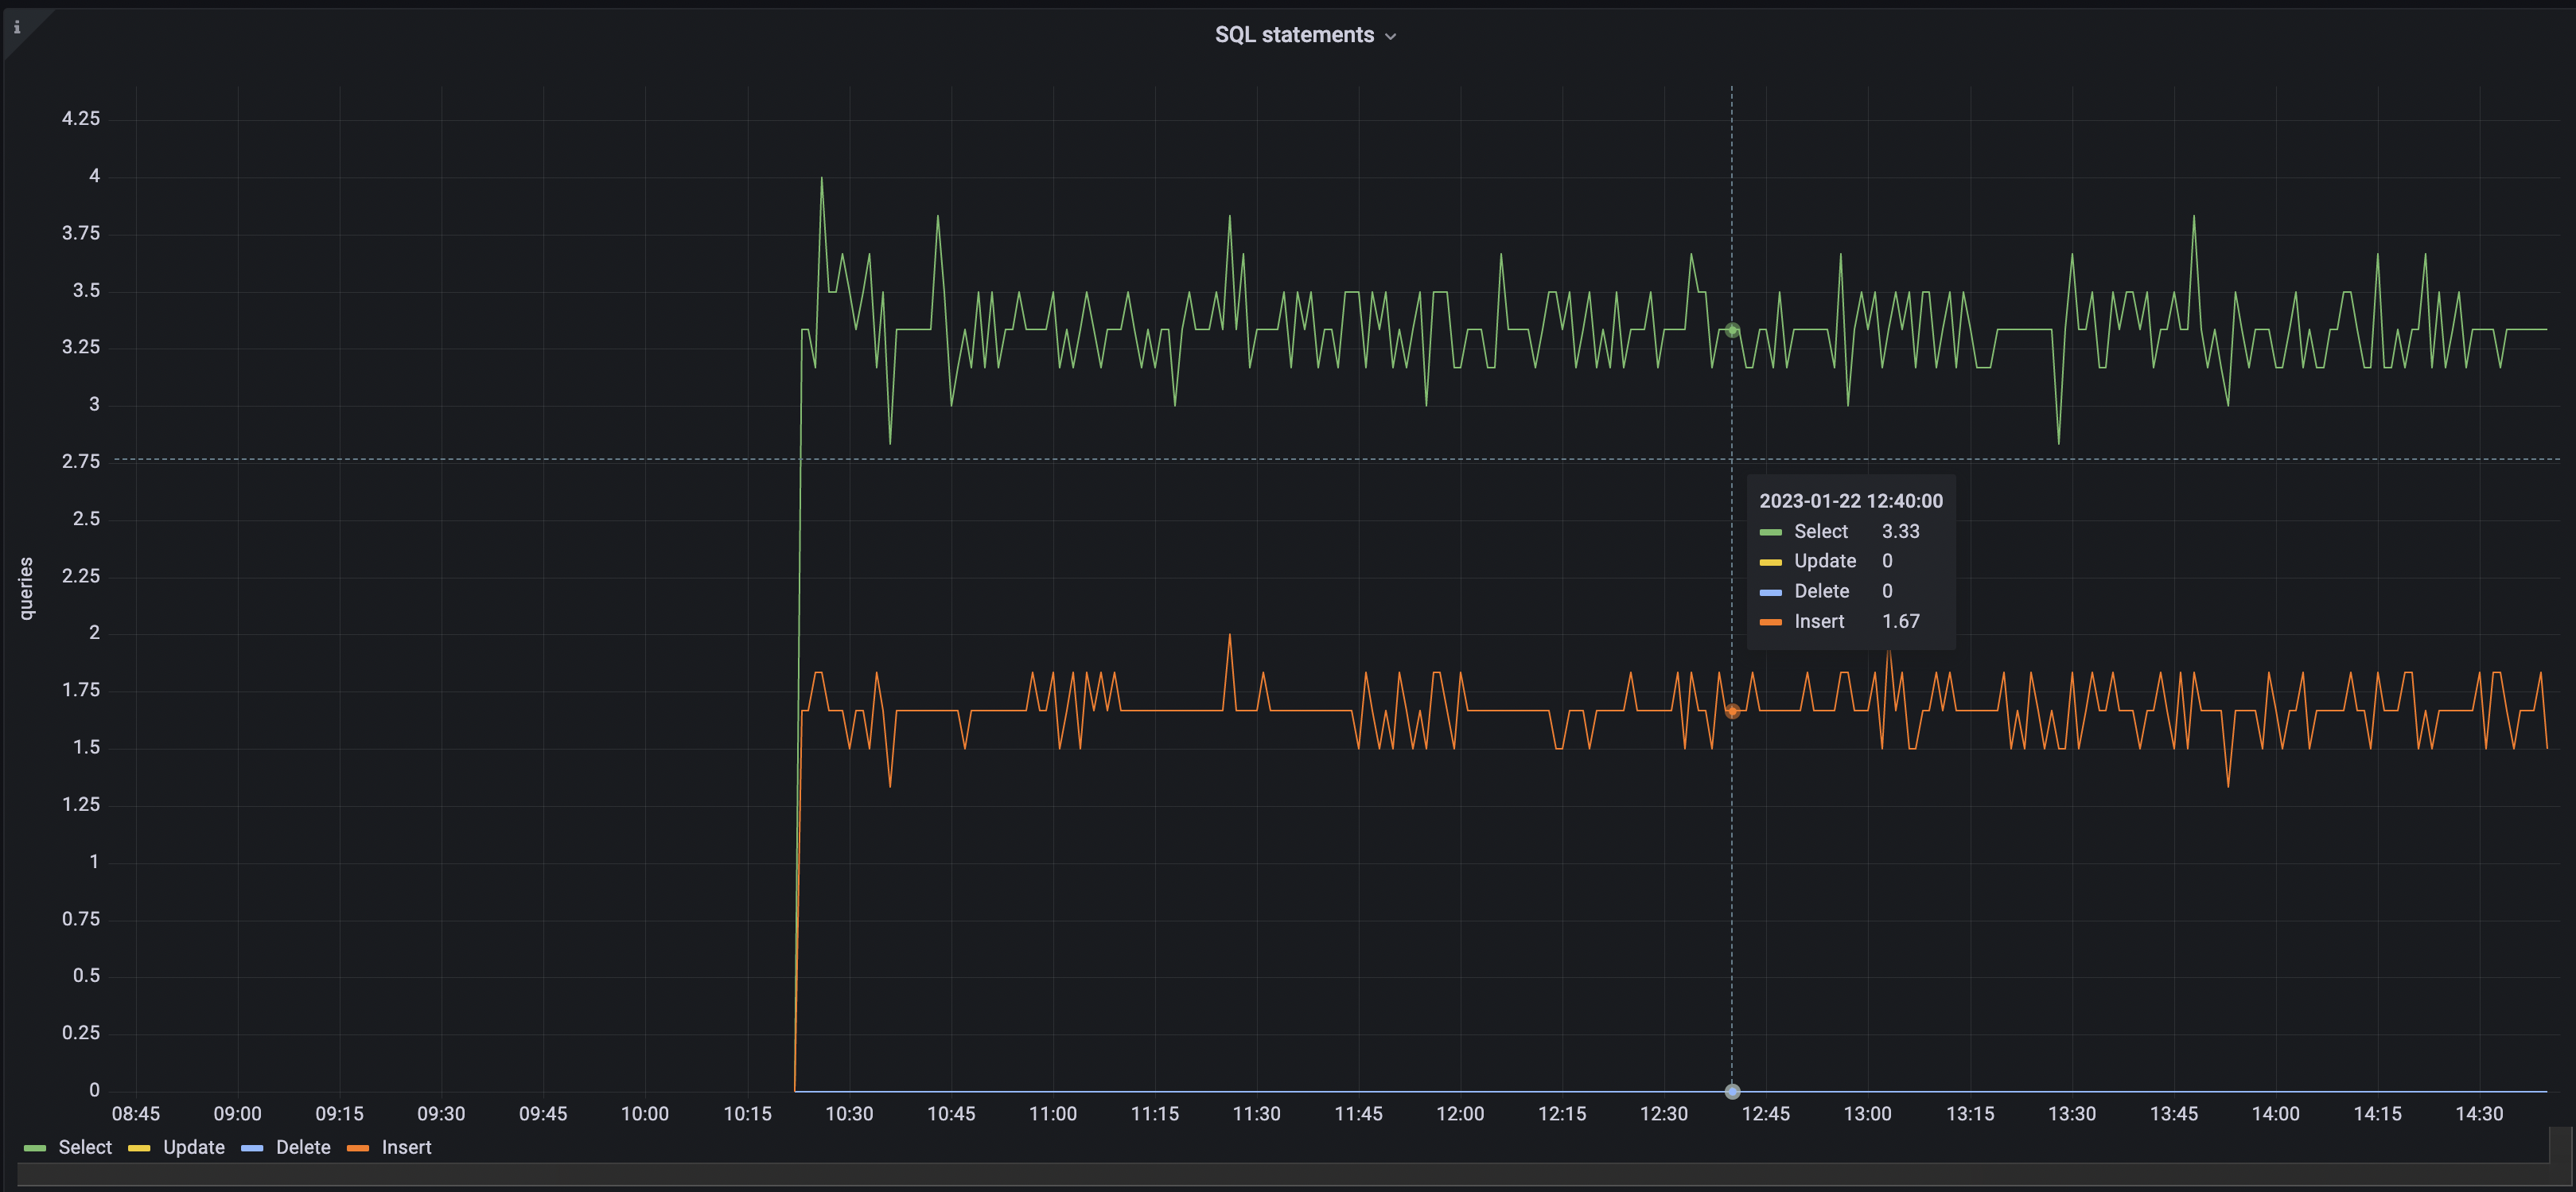
SQL Statements
Next we'll create a SQL Statements chart. This one will show the amount of Insert, Select, Update, and Delete statements across the cluster.
Below are the metric names we will use:
- INSERT:
crdb_dedicated.sql.select.count - SELECT:
crdb_dedicated.sql.insert.count - UPDATE:
crdb_dedicated.sql.update.count - DELETE:
crdb_dedicated.sql.delete.count
The rest of the settings should remain the same. The final result should look like this:
Conclusion and Next Steps
Overall I thought the Grafana integration steps for CloudWatch were really straight forward. I was able to set up a cloud account, connect my CloudWatch Data Source, and start creating a Dashboard in ~15 minutes.
Next steps include trying out more chart types. This includes node based metrics, or maybe a multi-region setup. Each of these items is configurable in the Dimensions part of the Query.
Here is my final Dashboard after adding a few more chart types:
