Viewing CockroachDB Dedicated Metrics in New Relic via Amazon CloudWatch
By Morgan Winslow at
Export CockroachDB metrics to CloudWatch, and use as a Data Source in New Relic
Overview
In this blog I'll continue to expand on the options available to us now that the CockroachDB dedicated offering can pipe metrics into Amazon CloudWatch. Here I will be looking into the New Relic integration process.
New Relic has a myriad of observability options across all areas of your stack. Although there is no specific CockroachDB integration, we are able to grab our metrics from CloudWatch. This is my first time using New Relic, but the end goal will be to end up with a couple of handy charts with our CockroachDB metrics.
Check out the other blog posts in this series:
- Viewing CockroachDB Dedicated Metrics in Grafana via Amazon CloudWatch
- Exporting Metrics from CockroachDB Dedicated into Amazon CloudWatch
High-Level Steps
You'll notice there's a bit more work involved here than in Grafana, as we need to provision Firehose infrastructure.
- Export CockroachDB metrics to Amazon CloudWatch. I will not be going over these details in this blog, but you can find all the steps in my previous blog: Exporting Metrics from CockroachDB Dedicated into Amazon CloudWatch
- Create an IAM Role and Policy to access metrics
- Use a CloudFormation Stack Template provided by New Relic to provision resources needed for the integration (namely Kinesis Data Firehose)
- Create sample charts in New Relic
New Relic documentation on these steps can be found here.
New Relic Integration with AWS CloudWatch
Although there is an additional step involved with setting up for New Relic, they do a good job providing step by step instructions for the integration.
Navigate to Infrastructure -> AWS -> Add an AWS Account. Choose the Metric Streams Integration Mode. New Relic does such a good job with these instructions that I'm just going to list the high level steps here.
- Create a Role with the Account ID and External ID provided by New Relic.
- Select the
ReadOnlyAccessPolicyfor the Permissions. This is a bit overkill in my opinion since it gives read access to ALL resources, but for this test that is fine for me. You may want to be more restrictive. - Review and create Role, taking note of the ARN.
- (optional) I skipped Step 4, Creating a Budget Policy, as I'm just running a quick test and it's not needed
- Add AWS Account Name and the ARN for your newly created Role
- There's a couple options here to configure the metric stream, but I chose to use the template option.
The template is a CloudFormation Stack Template, where all you need to add is your New Relic Ingest License Key. The page should look something like this:
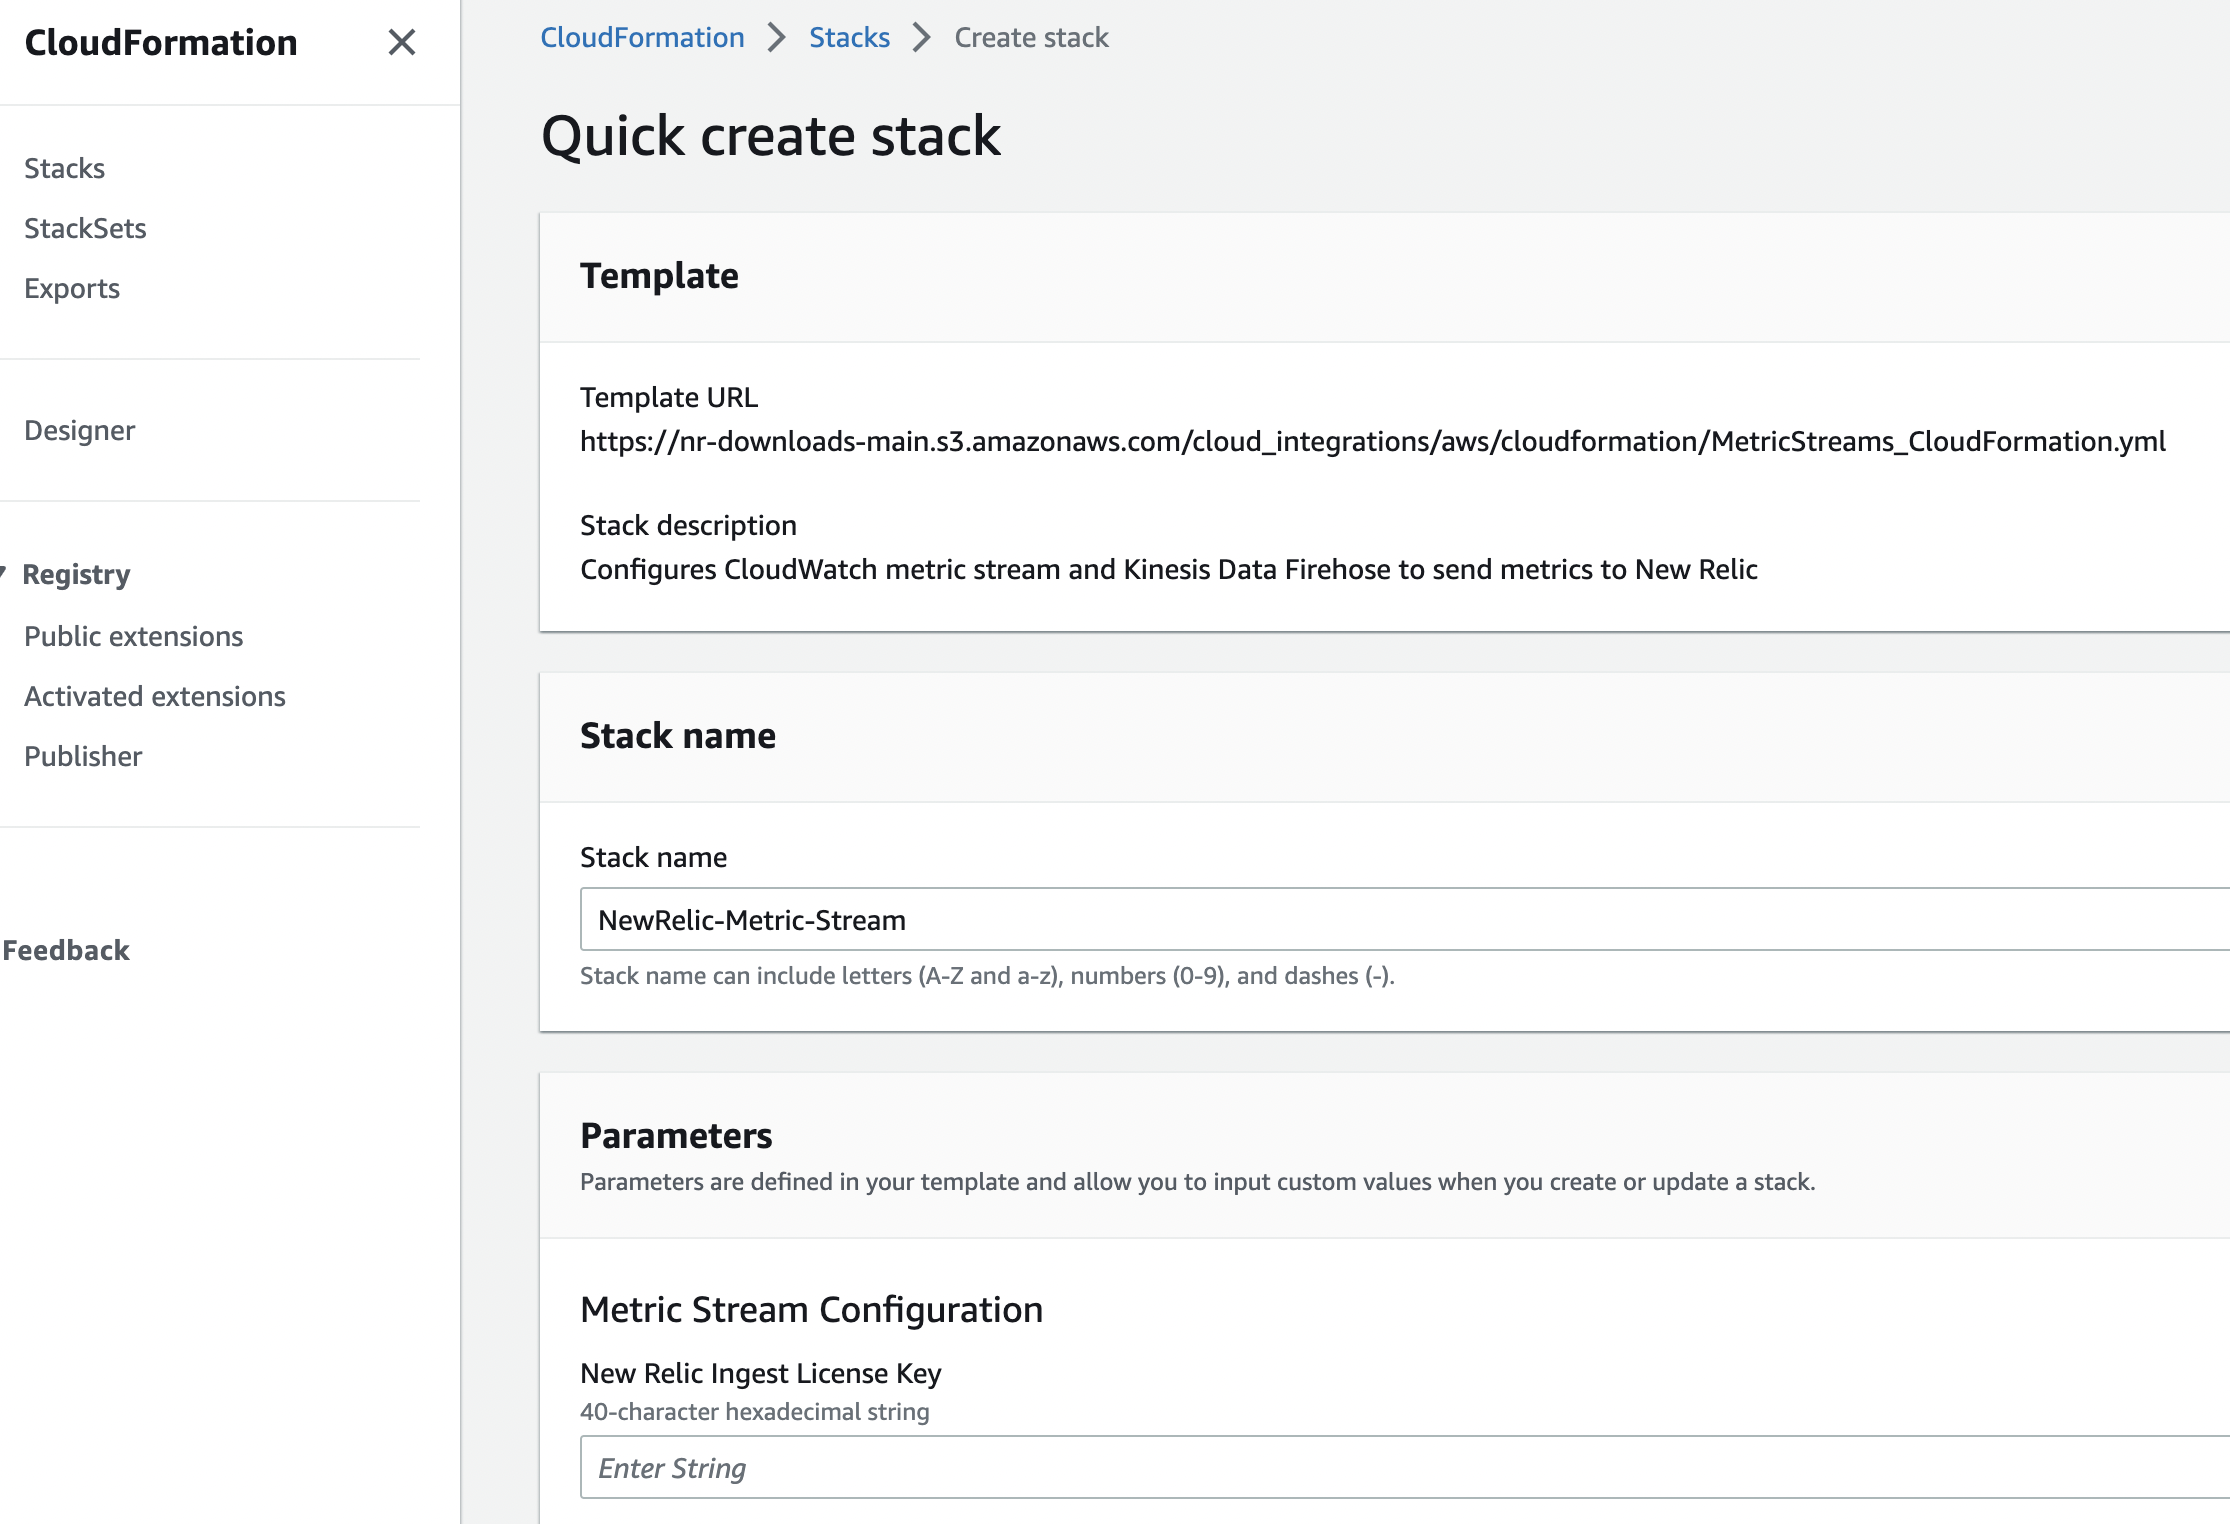
The template will create a CloudWatch Metric Stream, Kinesis Data Firehose Stream, Firehose S3 backup bucket, and the Roles required for each.
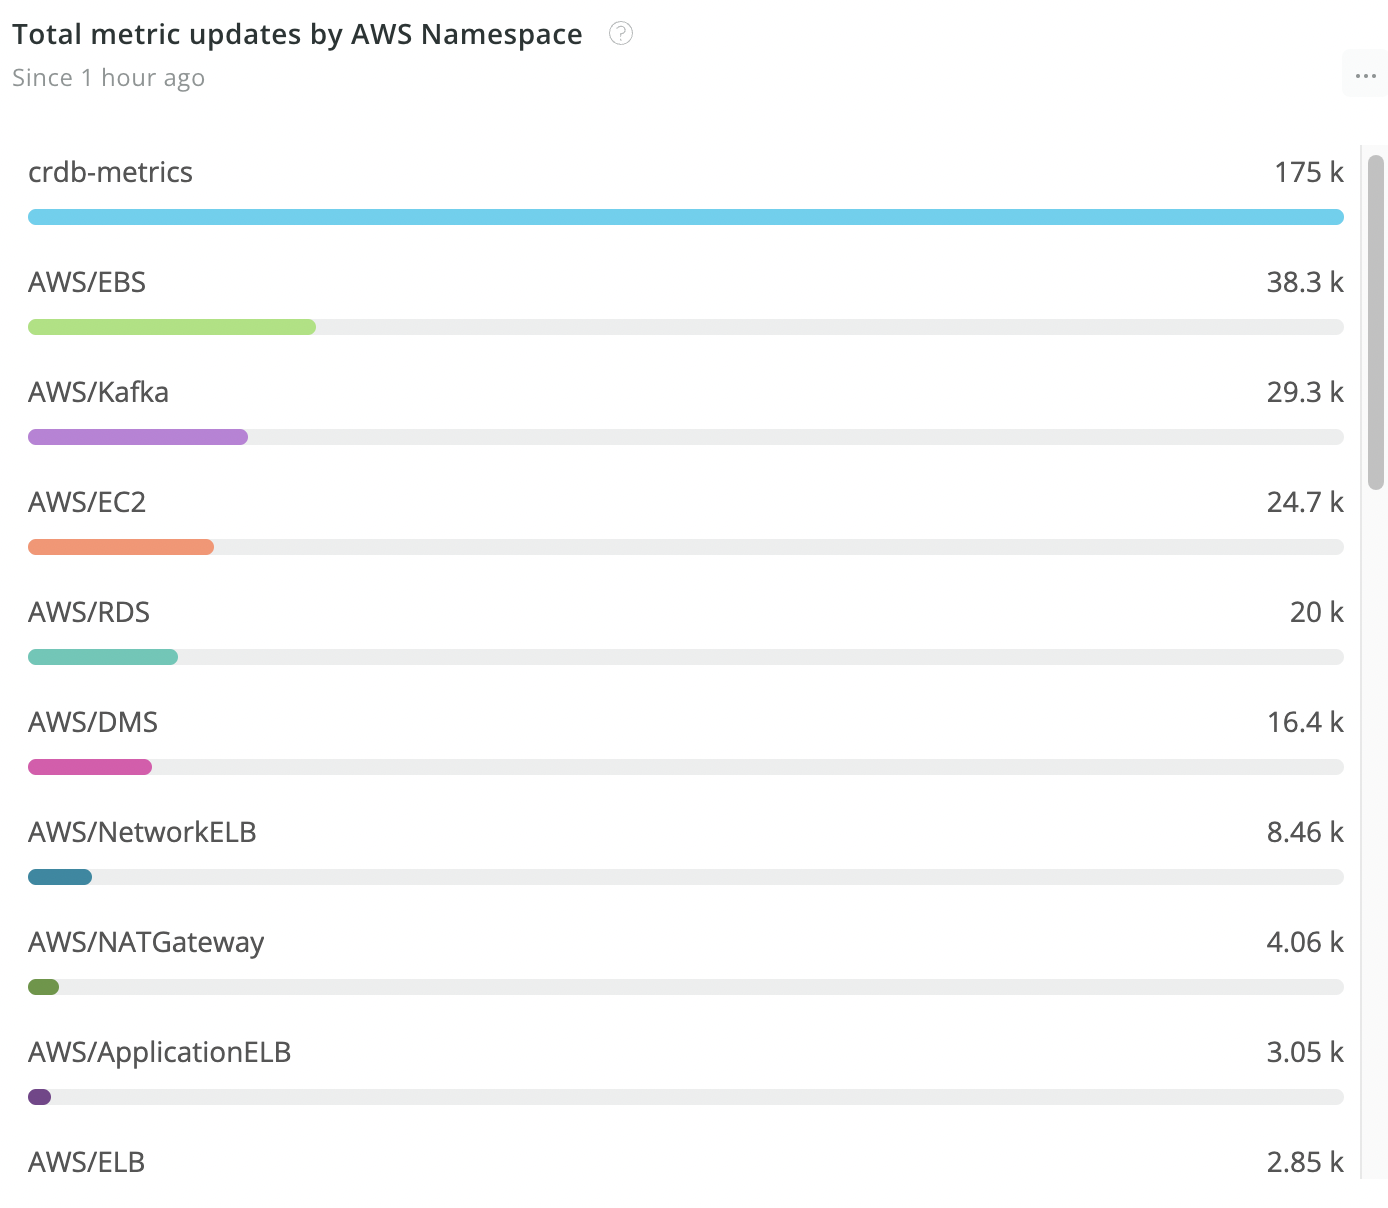
Once the stack is created, you should be able to navigate back to New Relic and see your account on the AWS page. Click 'Account status dashboard' to see that data is being collected. You'll notice in my setup that I'm collecting metrics from many different namespaces, but for this exercise I really just care about crdb-metrics.
Sample Charts
In New Relic, head to the Dashboards section and add a new widget where we will create a chart. Just as in my Grafana Blog, we will be re-creating a Capacity chart and SQL Statements Chart.
Capacity
Below are the metric names we will show for Capacity:
- Used:
aws.crdbmetrics.crdb_dedicated.capacity.used - Available:
aws.crdbmetrics.crdb_dedicated.capacity.available - Max:
aws.crdbmetrics.crdb_dedicated.capacity
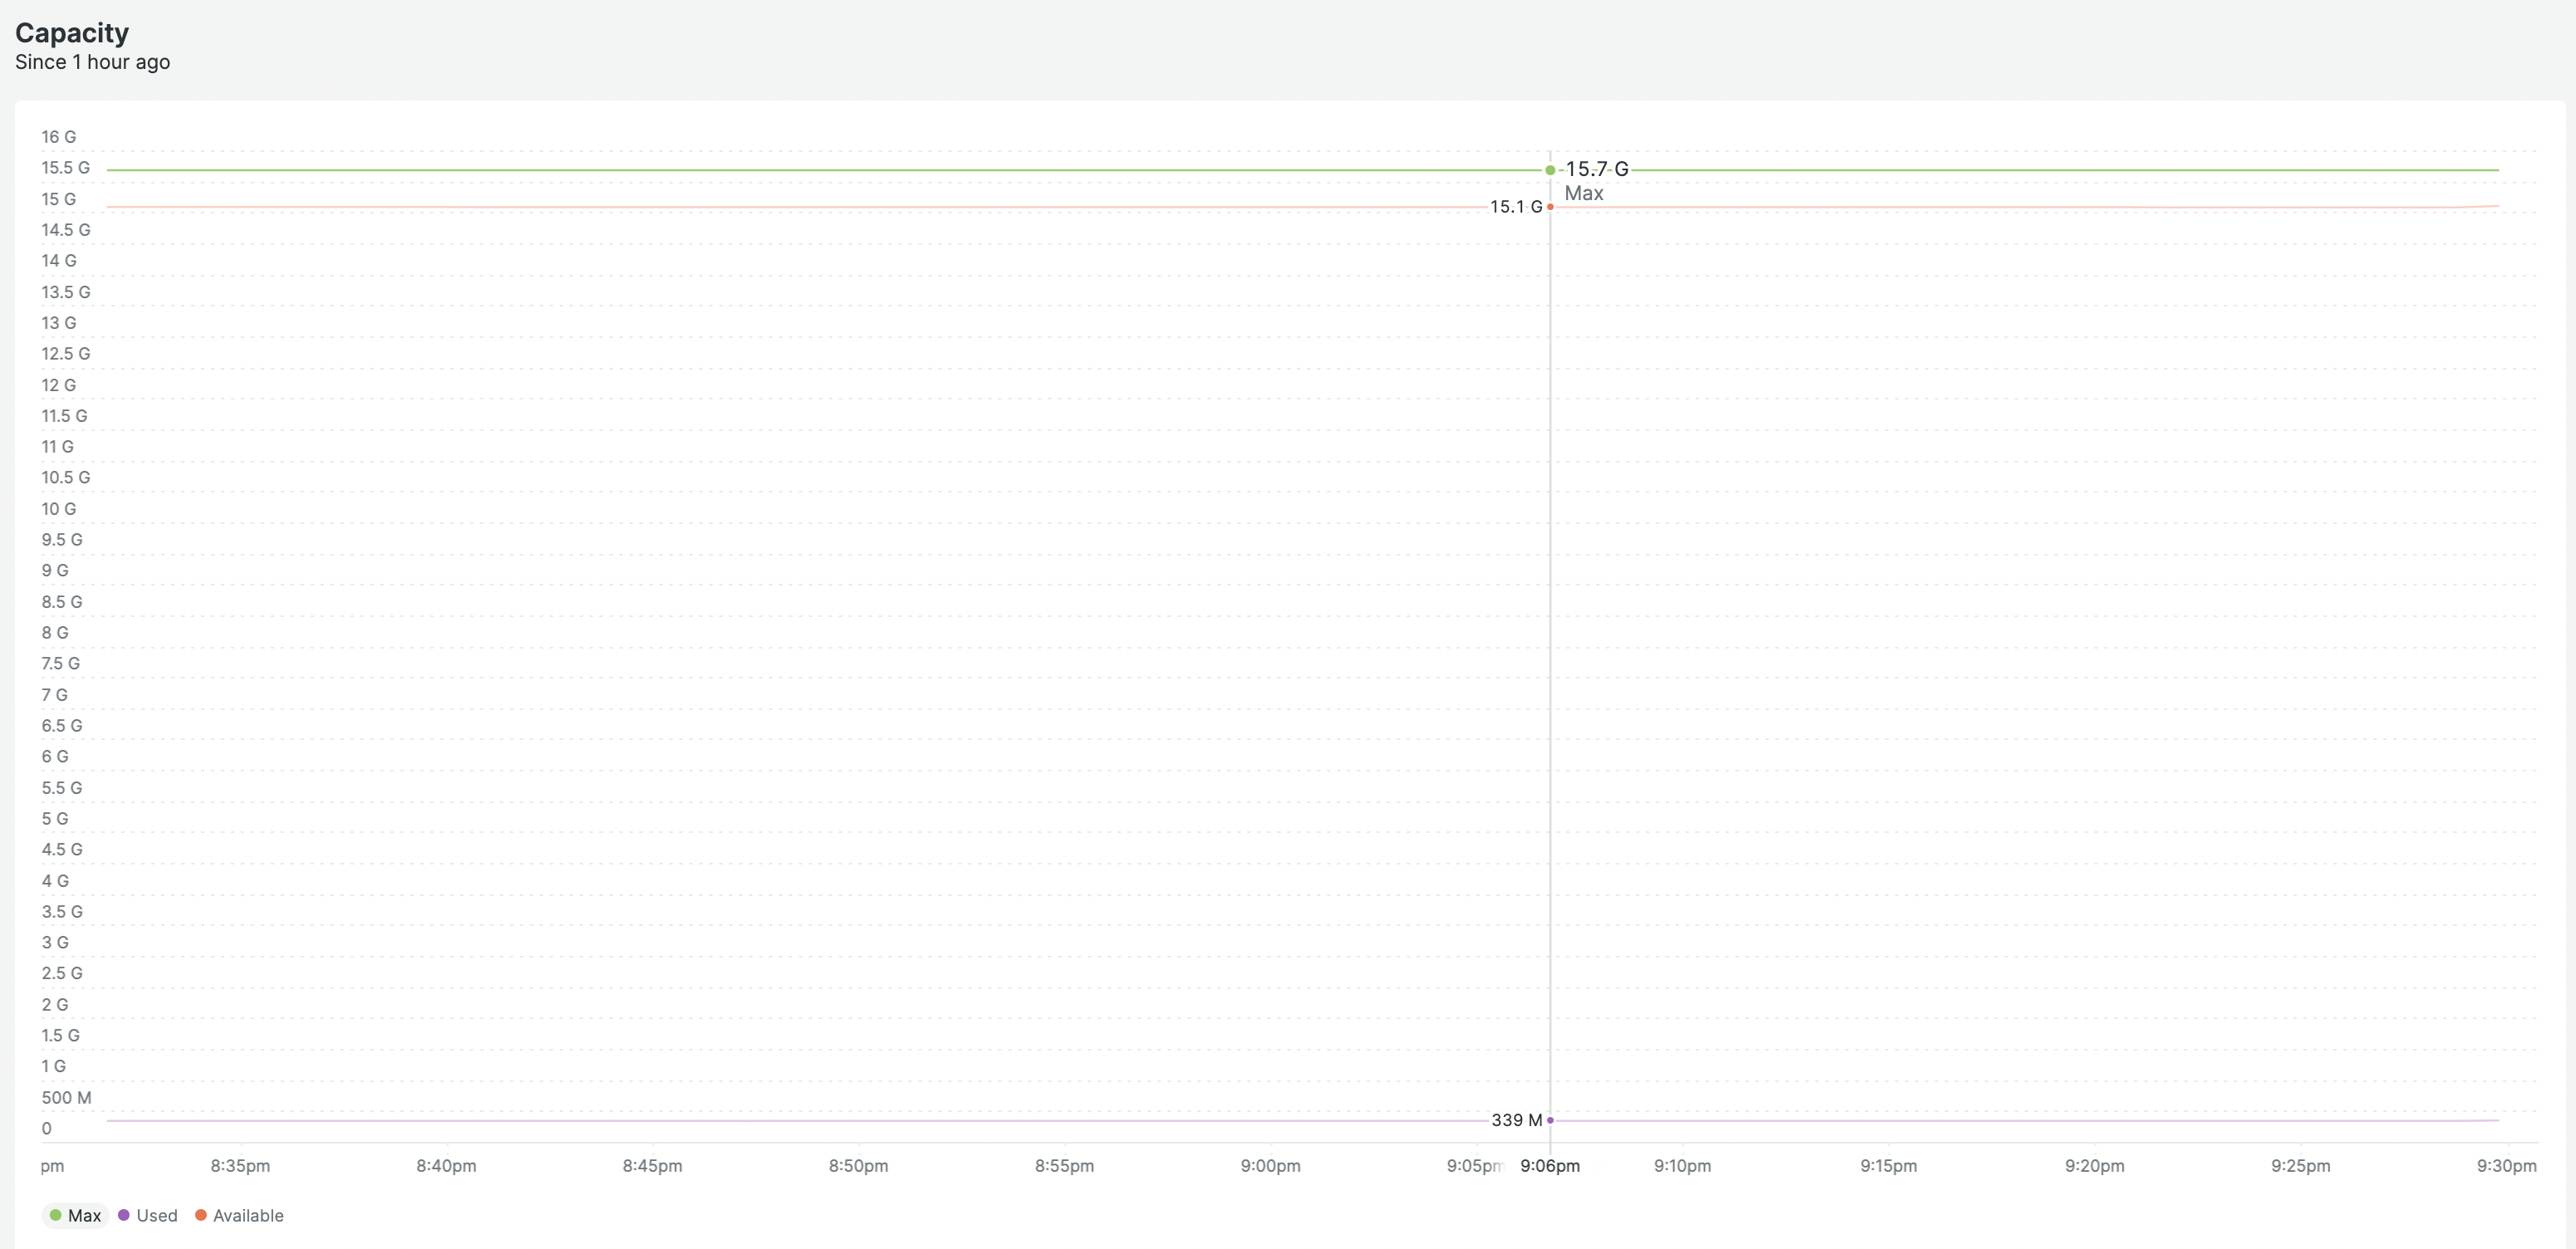
Once I got the hang of New Relic, I found it was easiest to use the NRQL (New Relic Query Language) style editor rather than some of the other options they have available. The below query is what I came up with for our Capacity chart.
SELECT Average(`aws.crdbmetrics.crdb_dedicated.capacity`)           AS 'Max',
       Average(`aws.crdbmetrics.crdb_dedicated.capacity.used`)      AS 'Used',
       Average(`aws.crdbmetrics.crdb_dedicated.capacity.available`) AS 'Available'
FROM   metric SINCE 60 minutes ago timeseries
WHERE  aws.crdbmetrics.cluster ='morgan-metrics'
This results in the following chart:
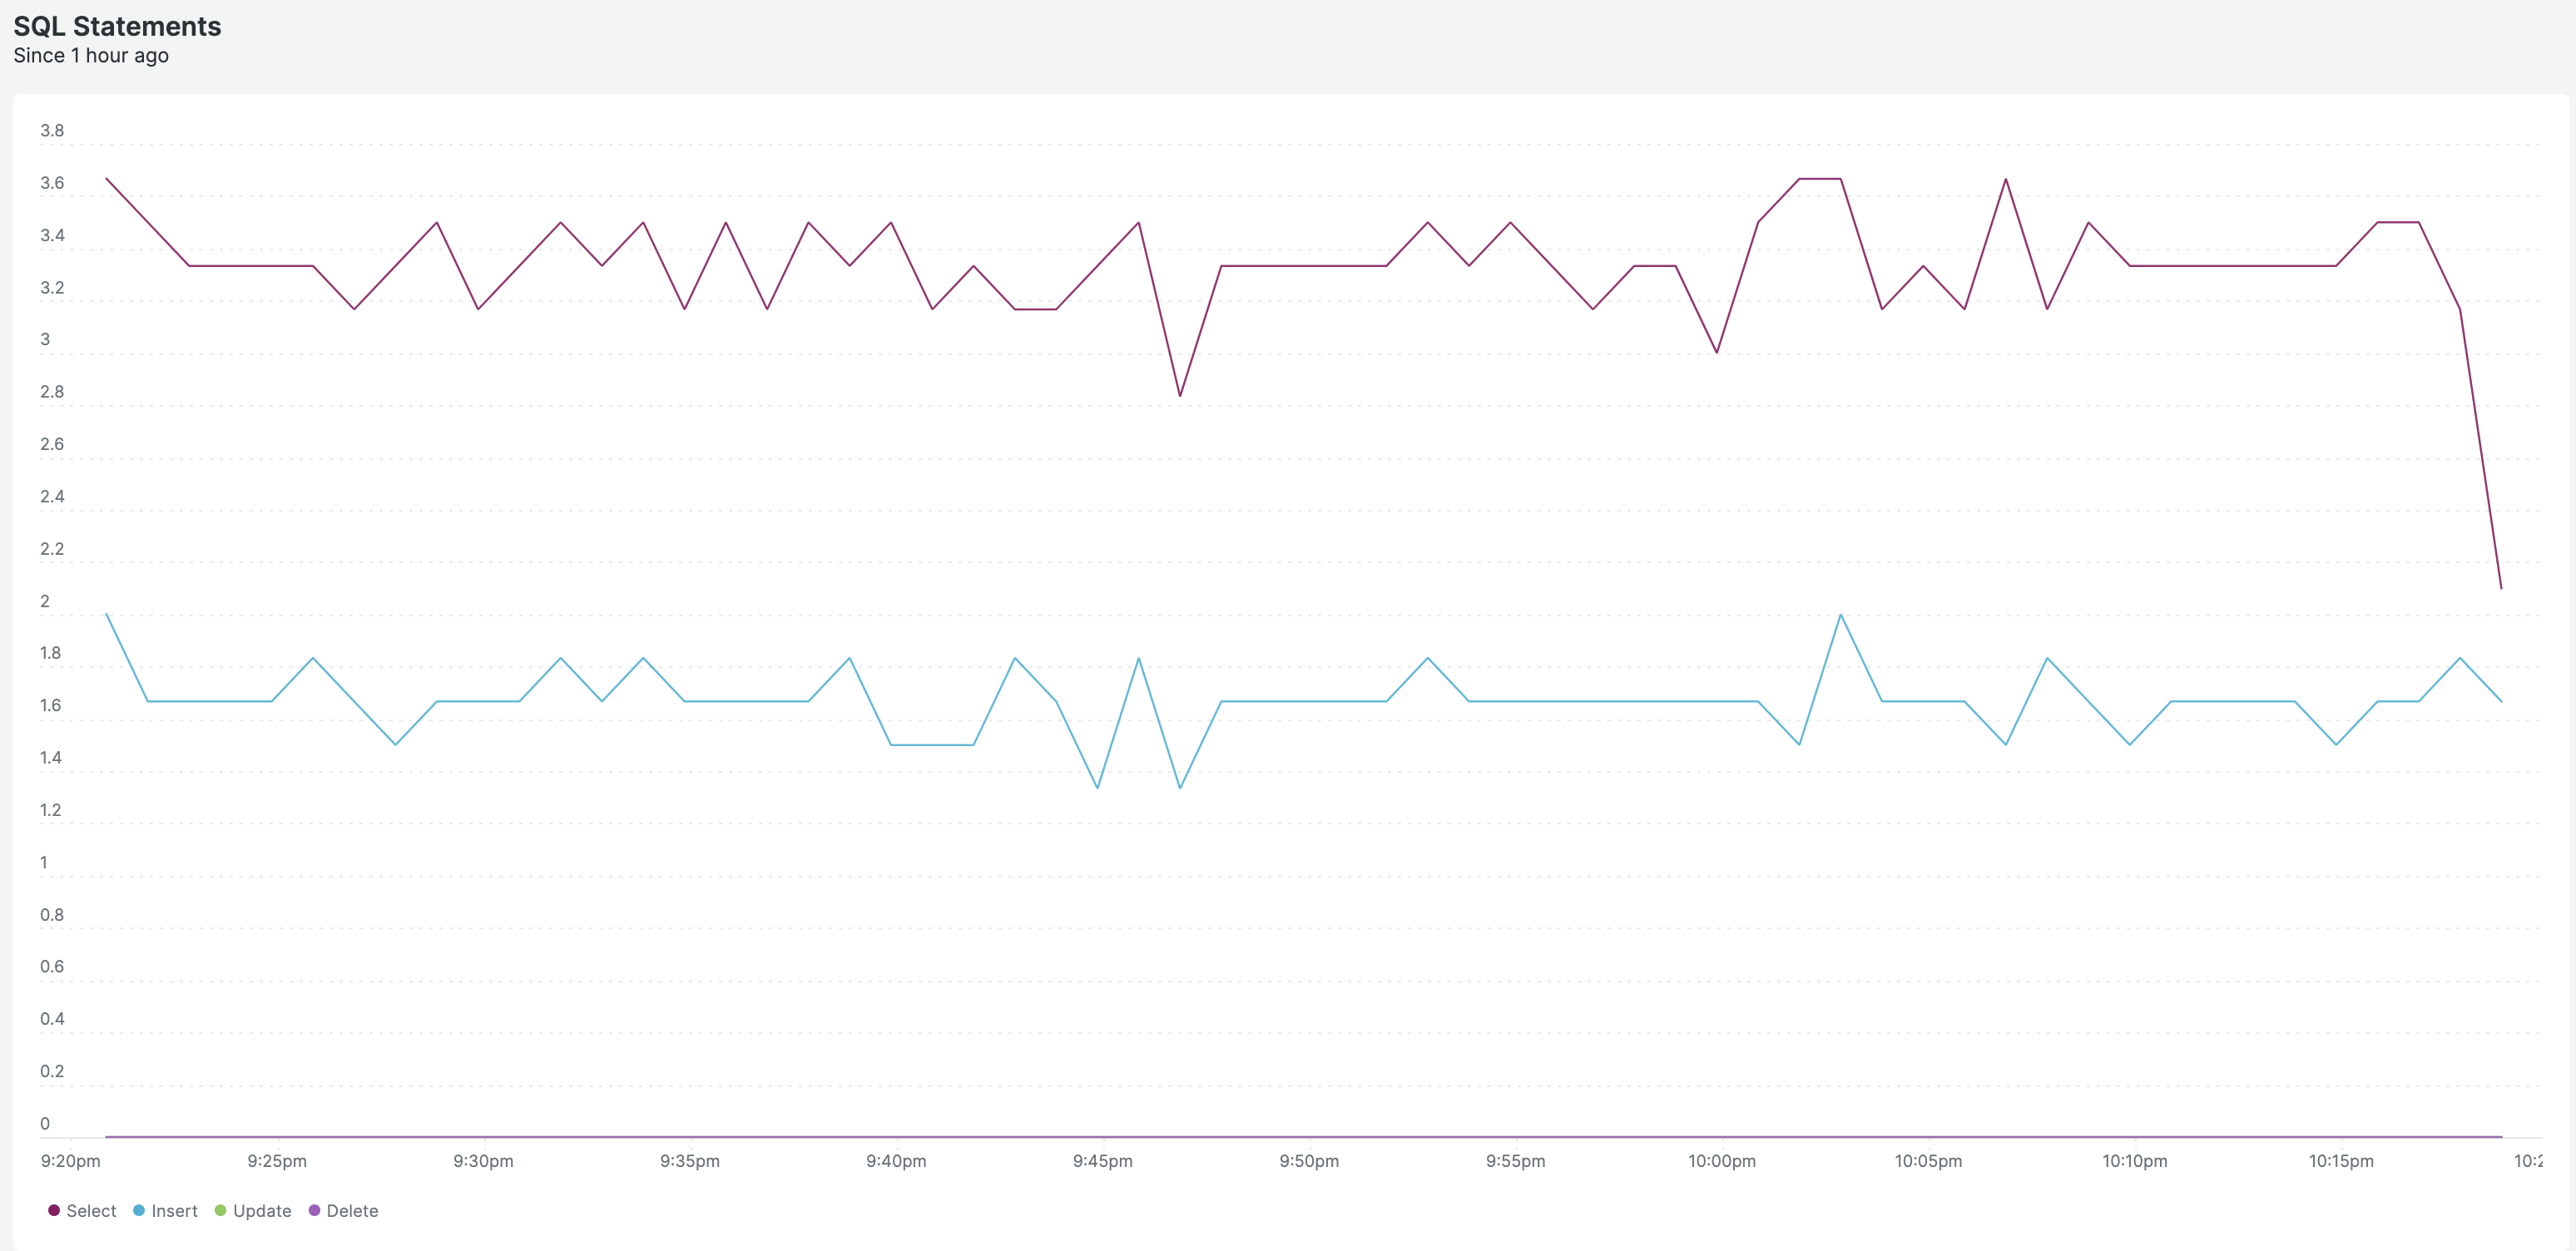
SQL Statements
Next we'll create a SQL Statements chart. This one will show the amount of Insert, Select, Update, and Delete statements across the cluster.
Below are the metric names we will use:
- INSERT:
aws.crdbmetrics.crdb_dedicated.sql.insert.count - SELECT:
aws.crdbmetrics.crdb_dedicated.sql.select.count - UPDATE:
aws.crdbmetrics.crdb_dedicated.sql.update.count - DELETE:
aws.crdbmetrics.crdb_dedicated.sql.delete.count
We'll use basically an identical NSQL query with these update metrics.
SELECT average(`aws.crdbmetrics.crdb_dedicated.sql.select.count`) AS 'Select',
       average(`aws.crdbmetrics.crdb_dedicated.sql.insert.count`) AS 'Insert',
       average(`aws.crdbmetrics.crdb_dedicated.sql.update.count`) AS 'Update',
       average(`aws.crdbmetrics.crdb_dedicated.sql.delete.count`) AS 'Delete'
FROM   metric since 60 minutes ago timeseries
WHERE  aws.crdbmetrics.cluster ='morgan-metrics'
Here is my chart result:
Conclusion
Overall I thought this integration was pretty straightforward, especially considering I was fresh to New Relic. I don't love that this integration includes an additional hop through Firehouse, rather than just straight from CloudWatch. I also didn't feel quite as comfortable using NSQL to create the charts.
All that being said, it was a quick integration and nothing too complicated to get going. If you are using New Relic to monitor across your stack, it will definitely be convenient to include CockroachDB metrics as part of this overall observability.